

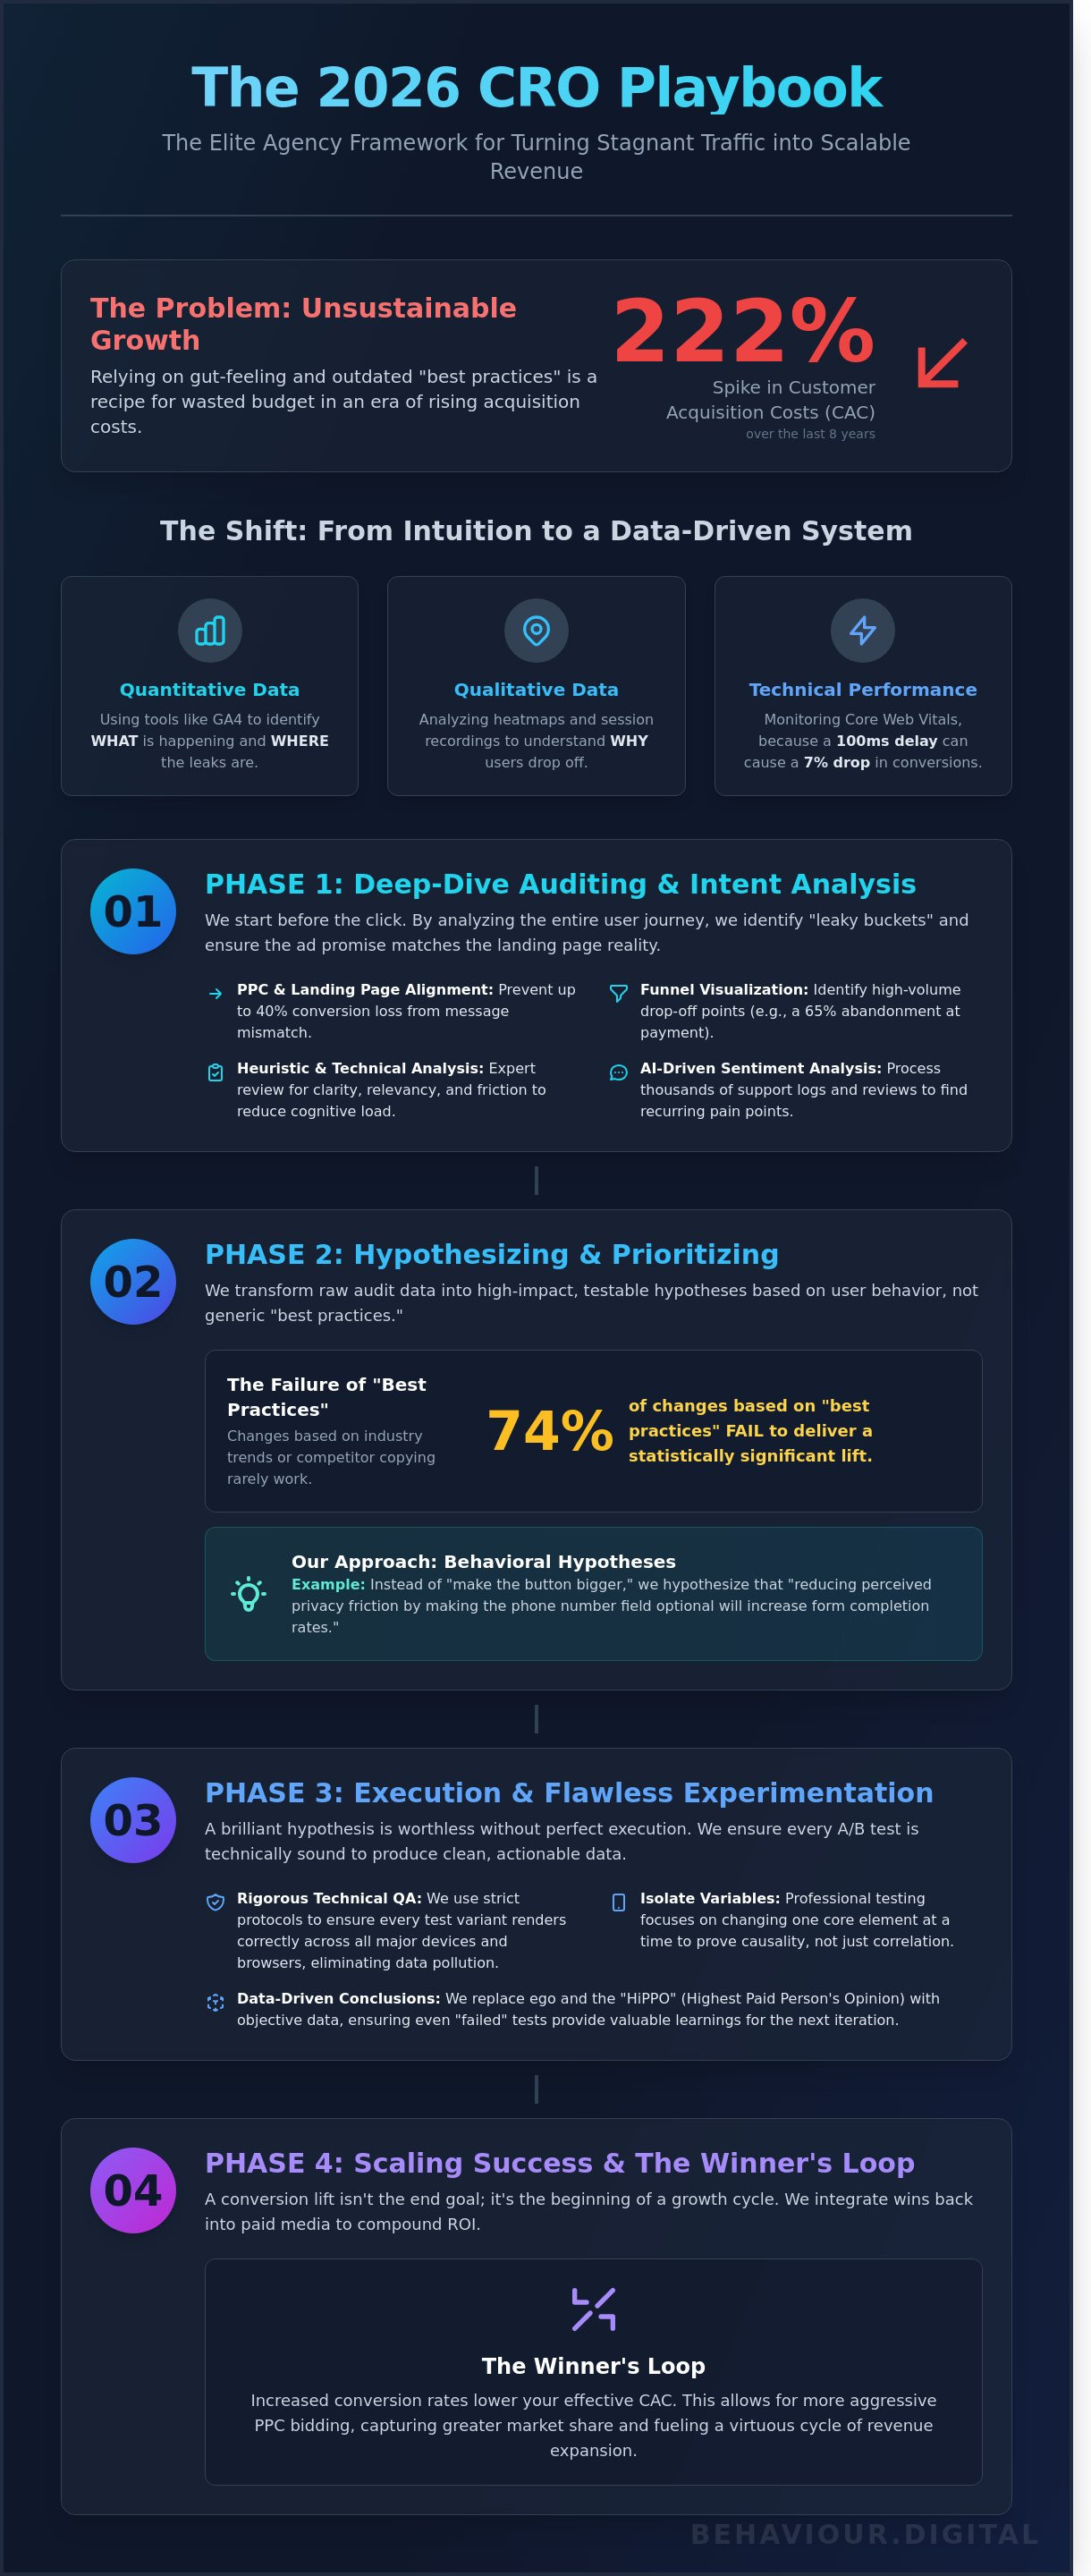
In 2024, research from SimplicityDX confirmed that Customer Acquisition Costs (CAC) have spiked by 222% over the last eight years. You've likely seen this trend reflected in your own margins as expensive ad traffic fails to convert, proving that a gut-feeling approach to your conversion rate optimization process is no longer sustainable. It's exhausting to navigate conflicting advice while your budget disappears into a black hole of non-converting clicks. Success isn't about luck or chasing the latest design trend; it's the result of a rigorous, data-driven strategy.
We're going to fix that by showing you the exact 7-step framework used by elite agencies to turn stagnant traffic into scalable revenue for 2026. This isn't a list of temporary hacks but a professional system for long-term growth. You'll gain a predictable method for increasing your revenue and a clearer understanding of the specific barriers stopping your users from checking out. We'll show you how to align your ad creative with your landing pages to ensure every dollar spent has a measurable impact on your bottom line.
• Understand why a systematic, data-driven methodology is required to thrive in a 2026 landscape dominated by AI-driven search.
• Learn to identify "leaky buckets" by visualizing the entire user journey and aligning your funnel with pre-click search intent.
• Implement a professional conversion rate optimization process that transforms raw audit observations into high-impact, testable hypotheses.
• Execute flawless experiments using rigorous technical QA protocols to ensure every test renders correctly and isolates the intended variables.
• Scale your growth through the "Winner’s Loop," integrating conversion gains with PPC management to enable more aggressive bidding and revenue expansion.
Conversion rate optimization isn't a series of aesthetic tweaks or gut-feeling adjustments to a landing page. It's a rigorous, data-driven methodology designed to increase the percentage of visitors who take a specific action. By 2026, the digital environment has shifted. AI-driven search engines now answer complex queries directly on the results page, which has reduced traditional click-through rates for informational queries by an average of 18% across most industries. This makes the traffic that actually reaches your site more expensive and significantly more precious. You don't need more traffic; you need the traffic you already have to perform better.
The conversion rate optimization (CRO) framework serves as a hedge against rising costs. In the current market, Customer Acquisition Cost (CAC) has climbed by 22% since 2024, driven by increased competition in ad auctions and stricter privacy regulations. When you improve your conversion rate, you're effectively lowering your CAC and increasing the Lifetime Value (LTV) of every user. A 1% increase in conversion doesn't just mean more sales today; it compounds the efficiency of every marketing dollar spent over the next fiscal year.
Modern strategy has moved past generic "best practices" like changing button colors to green or red. Data from 2025 shows that roughly 74% of changes based on industry best practices fail to deliver a statistically significant lift. Success now depends on "Behavioral Hypotheses." Instead of guessing, we analyze real user interactions to form a theory. If 40% of users abandon a form at the "Phone Number" field, the hypothesis isn't "make the button bigger," it's "reducing perceived privacy friction will increase completion rates." This shift from intuition to evidence-based testing is what defines a professional conversion rate optimization process.
We use Google Analytics 4 to identify the "What" and "Where." If data shows a 60% drop-off on the mobile checkout page, we know exactly where the leak is located.
Tools like heatmaps and session recordings reveal the "Why." We might see that users are trying to click an unlinked image or getting frustrated by a pop-up that's impossible to close on a small screen.
Speed is a psychological trigger. A 100ms delay in page load time can result in a 7% drop in conversions. We monitor Core Web Vitals to ensure technical friction doesn't kill user intent before they even see your offer.
Relying on the "HiPPO" (Highest Paid Person’s Opinion) is a recipe for wasted budget. Intuition is subjective; data is objective. A documented conversion rate optimization process removes ego from the room and replaces it with a scalable system. When you follow a repeatable framework, you stop looking for "silver bullets" and start generating incremental gains that compound over time. This systematic approach ensures that even "failed" tests provide valuable data that informs the next winning experiment. The CRO process is a perpetual cycle of research, testing, and learning designed to align user intent with business objectives through iterative refinement.
A successful conversion rate optimization process starts long before a user reaches your checkout page. It begins with the PPC funnel. We analyze search intent to ensure the promise made in the ad matches the reality of the landing page. If a Google Ads campaign targets "enterprise cloud security" but the landing page focuses on "small business antivirus," you've already lost 40% of your potential conversions due to message mismatch. We align every touchpoint to ensure the user journey feels like a single, continuous conversation.
We use funnel visualization to identify "leaky buckets" where users drop off in high volumes. In a 2023 audit for a SaaS client, we discovered a 65% abandonment rate at the "Add Payment Method" step. This wasn't a product value issue; it was a technical friction point. To find these bottlenecks, we employ heuristic analysis. This involves a 10-point expert review of your site's clarity, relevancy, and distraction levels. Reducing cognitive load by even 15% through better visual hierarchy can lead to immediate upticks in engagement.
Data tells us what is happening, but we use AI-driven sentiment analysis to understand why. By processing over 5,000 customer support logs and reviews from the last 12 months, we identify recurring pain points. This data-driven CRO process removes the guesswork from our strategy. We don't rely on "best practices" that might not apply to your specific niche; we rely on the documented frustrations of your actual users.
Precision is everything in the conversion rate optimization process. We segment conversion rates by device, traffic source, and landing page to isolate outliers. If mobile traffic shows a 0.7% conversion rate while desktop sits at 3.9%, the problem is likely technical or UX-related on smaller screens. We prioritize high-bounce, high-intent pages. These are pages receiving significant paid traffic that fail to convert. Fixing a headline or a CTA on a page with 10,000 monthly visits offers a much higher ROI than tweaking a low-traffic blog post. We cross-reference PPC keyword intent with landing page messaging to ensure 100% consistency.
Numbers provide the skeleton, but qualitative research provides the meat. We use scroll maps to verify if your primary Value Proposition is actually being seen. Our 2024 data shows that 72% of users never scroll past the first 500 pixels of a landing page. If your "Buy Now" button is lower than that, it doesn't exist for most people. We implement exit-intent surveys to capture the "Reason for Not Converting" at the exact moment of departure. This real-time feedback is invaluable. Additionally, we conduct remote usability testing with 5-10 participants to identify where they get confused during the checkout process. This type of strategic auditing ensures that our subsequent testing phase is built on a foundation of hard evidence rather than assumptions.
Data collected during the audit phase is only valuable if it's translated into a structured roadmap. The systematic process of increasing the percentage of users who complete a goal depends on moving from "I think" to "I know." We do this by building rigorous hypotheses. A weak hypothesis is just a guess; a strong one is a business case. Every test must follow a strict anatomy: the Variable (what we change), the Predicted Outcome (the metric we expect to move), and the Rationale (the psychological or data-driven reason why).
If we change the checkout CTA from "Submit" to "Secure My Order," then conversion rates will increase by 8% because the new copy reduces "buyer's remorse" anxiety. This level of detail ensures that even a "failed" test provides a learning. Testing five variables at once is a common mistake that pollutes data. If you change the headline, the hero image, and the button color simultaneously, you'll never identify the actual driver of growth. Isolation is the key to a scalable conversion rate optimization process.
Low-traffic environments require a different tactical approach. For sites with under 10,000 monthly unique visitors, traditional A/B testing often fails to reach statistical significance within a standard 30-day window. In these cases, we pivot to "Big Rock" changes. Instead of testing a button color, we test a completely different value proposition or page layout. We also track micro-conversions, such as scroll depth or clicks on a pricing toggle, to gather directional data faster than waiting for final sales numbers.
You can't test everything at once. We use the ICE framework (Impact, Confidence, Ease) to rank ideas quickly. It's built for agility. If a test has high impact but low ease because it requires 40 hours of development, it moves down the list. Conversely, Salesforce and other enterprise entities often lean toward the PIE framework (Potential, Importance, Ease). PIE forces you to look at the "Importance" of a page; testing a high-traffic landing page is always more valuable than testing a "Terms of Service" page. A 2023 industry survey showed that 42% of high-growth agencies prefer ICE for its ability to balance technical debt with quick wins.
Success isn't defined by a single metric. While revenue is the primary goal, we monitor secondary metrics like average order value (AOV) or add-to-cart rates to understand the "why" behind the "what." It's vital to set "Counter-metrics" to protect the business. If a change increases the conversion rate by 12% but spikes refund rates by 5%, it's a net loss for the company. We don't stop a test until it reaches a 95% statistical significance level. This usually requires a minimum of 250 to 400 conversions per variation to ensure the results aren't just a product of random chance or weekend traffic spikes. This disciplined approach to the conversion rate optimization process is what separates professional growth partners from amateurs.
Execution is the stage where strategy transforms into measurable data. You've built your hypothesis; now you must isolate the specific variable to ensure your results aren't polluted. If you modify the headline and the primary CTA button color simultaneously, you won't know which element drove the 14.2% lift in click-through rates. Step 1 requires designing a variation that changes only the targeted component, maintaining a strict control environment for the conversion rate optimization process.
Technical QA serves as the second critical step. In 2026, cross-device fragmentation is high. You must verify that your test renders perfectly on Chrome 130+, Safari 19, and the latest mobile viewports. We use automated scripts to check for layout shifts; a Cumulative Layout Shift (CLS) score above 0.1 during a test can frustrate users and skew your conversion data. Accuracy at this stage prevents expensive mistakes later.
Launching the test involves 2026-standard server-side tools. Client-side testing is largely obsolete for high-performance brands because it introduces latency. We utilize edge computing to inject variations directly at the server level, ensuring zero performance impact. During the initial 24 hours, monitor your dashboards for "flicker" or data anomalies. If one variation shows a 0% conversion rate while the other shows 5%, it's likely a tracking error, not a user preference. Don't touch the test once it's stable. Analyzing results before the pre-determined 14-day duration or before reaching a 95% statistical significance level leads to false positives.
A/B testing remains the gold standard for isolating the impact of a single major change, such as a new value proposition. It's efficient and yields clear answers quickly. Multivariate testing (MVT) is reserved for high-traffic environments, typically those exceeding 100,000 monthly unique visitors. MVT tests combinations of elements, like headlines and images together, to find the optimal "recipe." If you're planning a radical architectural shift, use Split URL testing to host the new layout on a different path and compare it against the legacy version.
A "losing" test isn't a failure; it's a documented insight that prevents you from implementing a harmful change. If a variation loses by 8%, you've just saved the business from a permanent revenue drop. Dig into the segments. Often, a variation loses on desktop but wins by 12% on mobile. This data allows you to personalize the experience based on device type. Use these findings to iterate on your hypothesis. A failed test often reveals more about your audience's hidden friction points than a winning one, fueling the next audit phase with higher-quality data.
Success in digital growth isn't about guessing; it's about a rigorous, data-driven conversion rate optimization process that turns insights into revenue.
Scaling isn't just about increasing your ad spend. It's about maximizing the efficiency of every pound you've already invested. At Behaviour Digital, we view the conversion rate optimization process as a full-funnel growth engine rather than a series of isolated tweaks. When your website converts traffic more effectively, your entire marketing ecosystem becomes more profitable. This creates what we call the Winner’s Loop. In this cycle, higher conversion rates allow you to bid more aggressively in PPC auctions without sacrificing your profit margins. If your conversion rate moves from 2.5% to 4.0%, your cost per acquisition drops significantly, giving you the financial leverage to dominate your competitors in the search results.
Most agencies treat CRO as a one-off project. We don't. We help Glasgow businesses transition from sporadic testing to a culture of continuous experimentation. This shift is vital because consumer behavior isn't static. A landing page that performed well in January 2024 might underperform by October 2024 due to shifting market trends or new competitor entries. By maintaining a constant pulse on user data, we ensure your digital assets evolve alongside your audience. Our data-first Scottish expertise means we understand the local market nuances while applying global standards of analytical rigour to your campaigns.
The most immediate gains often come from aligning your paid traffic with your on-site experience. We dive deep into your PPC search term reports to identify exactly what your customers are looking for. If a user searches for "bespoke office fit-out Glasgow," we don't just send them to a general homepage. We use those insights to rewrite landing page headlines for 1:1 relevance. This precision does more than just boost conversions; it directly improves your Google Ads Quality Score. High relevance leads to lower costs per click, effectively giving you a discount on your advertising. In March 2024, a Glasgow-based retailer partnered with us to align their ad copy with specific CRO test winners. The result was a 40% increase in ROI within 90 days, as we reduced bounce rates and streamlined the path to purchase.
Transparency is the cornerstone of our partnership. We provide monthly reporting that cuts through the noise of vanity metrics like clicks or impressions. Instead, we focus on how the conversion rate optimization process connects to your actual bank balance growth. You'll see exactly which tests won, which lost, and how those results translated into measurable revenue. We believe in proving our value through data before you make a long-term commitment. That's why we offer a free initial conversion audit for UK-based businesses. We'll analyze your current funnel, identify the largest friction points, and show you exactly where you're leaving money on the table.
Stop guessing why your visitors aren't converting. Let our team of analysts build a roadmap for your scalable growth. Success is a result of strategy, not luck.
Success in the coming year won't happen by accident. It requires a transition from reactive changes to a proactive, systematic conversion rate optimization process. By the start of 2026, data-driven intent analysis and high-velocity experimentation will be the only way to maintain a competitive edge in crowded markets. You've seen how auditing and prioritization create a clear path to ROI. Now it's time to execute with surgical precision. Stop guessing what your users want and start measuring what they actually do.
Behaviour Digital operates as your dedicated strategic partner. We're Glasgow-based strategic experts who deliver results without the marketing fluff. Our methodology focuses on transparent, data-driven reporting that shows you exactly where your growth originates. With a proven track record in PPC and Social Media scaling, we've helped brands increase their lead quality by 35% while reducing acquisition costs. We don't just run tests; we build scalable systems that turn user behavior into predictable revenue. Your business deserves a strategy rooted in facts, not feelings.
Maximize your digital growth with our expert CRO process
The roadmap to your most profitable year yet is ready for implementation. Let's start building it today.
The conversion rate optimization process typically requires 90 to 180 days to deliver statistically significant revenue growth. Initial wins often appear within the first 30 days during the technical audit phase; however, a full cycle of testing and implementation demands a longer horizon. We prioritize high-impact changes that generate a 10% to 15% lift in the first quarter. Data integrity relies on enough traffic cycles to prove a hypothesis correct before scaling.
You don't need millions of visitors, but we recommend at least 500 monthly conversions for valid A/B testing. If your traffic is lower, we shift the focus to qualitative research like heatmaps or 1-on-1 user interviews. These methods identify friction points for 95% of users without needing massive datasets. Small-scale sites often see the fastest growth by fixing obvious technical hurdles that block the existing 5% of potential buyers.
SEO focuses on driving organic traffic through search rankings while CRO focuses on converting that existing traffic into paying customers. Think of SEO as the engine that brings 10,000 visitors to your door and CRO as the salesperson who ensures 500 of them make a purchase. Both are essential for a 300% ROI. SEO increases your reach; CRO increases your efficiency and profit margins by maximizing the value of every click.
You calculate your conversion rate by dividing the total number of conversions by the total number of unique visitors and multiplying by 100. If your site had 50 sales from 2,000 visitors last month, your rate is 2.5%. We track this metric across specific segments to identify which channels underperform. Precise tracking ensures you aren't wasting 40% of your budget on low-intent traffic sources that dilute your overall performance data.
In 2026, the industry leaders are VWO for enterprise flexibility, Statsig for feature flags, and PostHog for integrated product analytics. These tools provide 99.9% data accuracy and integrate directly with modern data warehouses like BigQuery. Choosing the right stack depends on your specific volume. We've seen companies reduce their testing overhead by 25% by switching to server-side experimentation platforms this year to avoid browser-based flickering issues.
You can perform basic CRO yourself using free tools like Google Analytics 4, but scaling a professional conversion rate optimization process requires a dedicated team of data analysts and UX designers. Most in-house teams struggle to run more than 1 test per month. An agency partner typically increases testing velocity by 400% through established frameworks. Professional intervention prevents common statistical errors that lead to a 20% loss in potential revenue.
A good conversion rate for UK e-commerce averages between 2.1% and 4.8% according to 2025 retail benchmarks. Finance and B2B SaaS sectors often see higher rates, sometimes reaching 10% for targeted lead generation pages. Don't chase industry averages blindly. We focus on beating your previous month's baseline by at least 0.5% to ensure consistent, compounding growth tailored to your specific market position and customer behavior.
A negative A/B test result is a valuable data point that prevents you from implementing a harmful change site-wide. Roughly 50% to 70% of experiments fail to show a positive lift. We analyze the losing data to understand why users rejected the variation. This insight often leads to a 2x stronger hypothesis for the next test cycle. Turning a temporary setback into a strategic advantage is what separates data-driven brands from those guessing.
.png)
.png)
We help clients all over the globe grow their digital advertising campaigns. Ready to see what we can do for you? Get started with your free growth plan.
GET STARTED