

Your PPC dashboard is lying to you. It’s a wall of numbers; clicks, impressions, and a climbing CTR all suggest progress, but they don't answer the one question your CFO keeps asking: "Are we actually making money from this?" You’re spending significant budget, but the path from ad spend to real business growth feels foggy, lost in a sea of data that looks impressive but feels hollow. This information overload isn't just frustrating; it's a barrier to effective decision-making.
This guide changes that. We're cutting through the noise to define the PPC metrics that will matter most in 2026. You won't just learn what to track; you'll gain a complete, data-driven framework to improve your ROAS, allocate budget with confidence, and translate campaign performance into the language of business growth. Forget vanity data. We're about to build a reporting system that connects every click to profit and every campaign to scalable success.
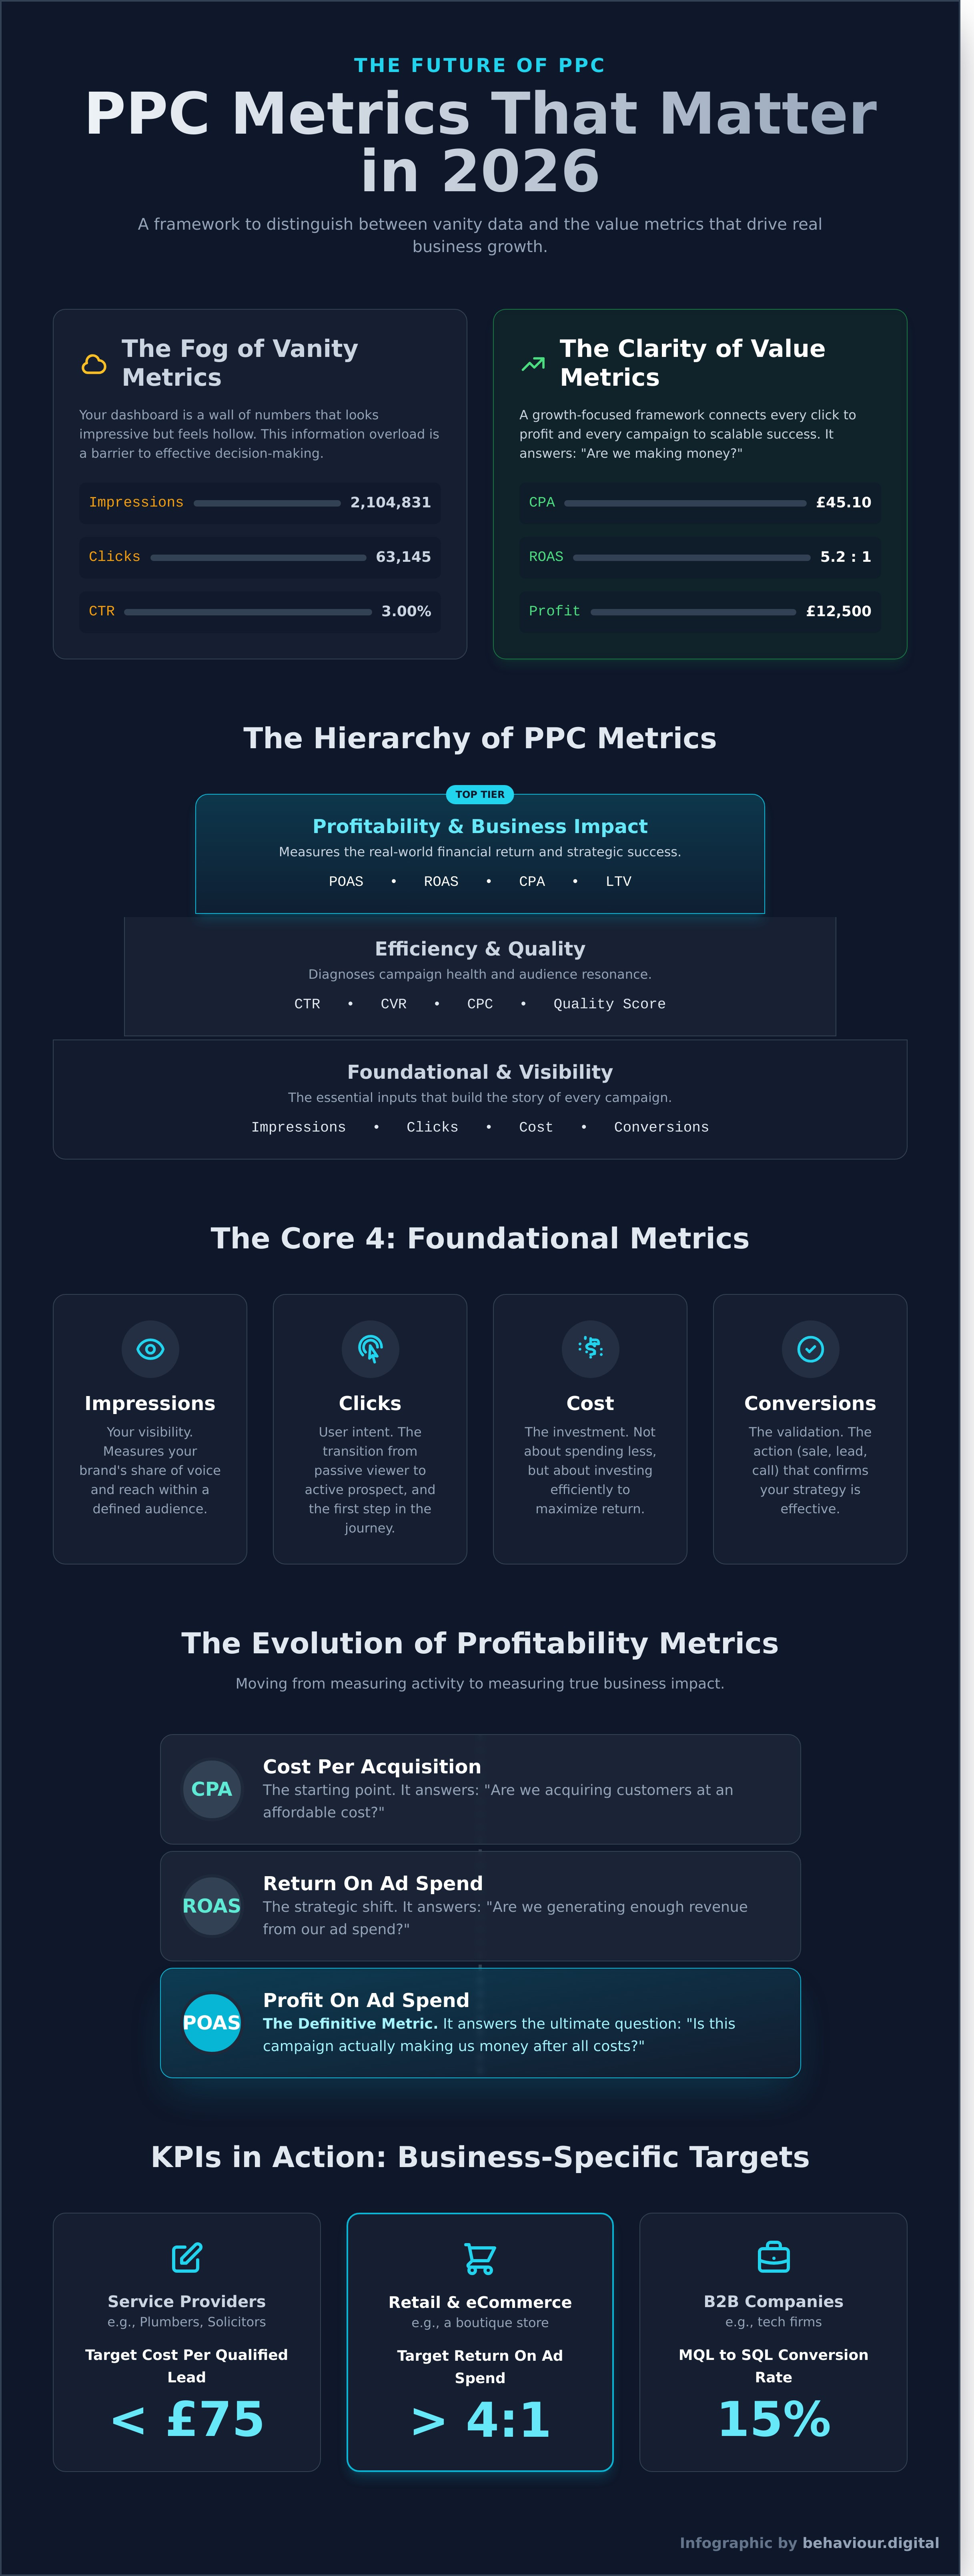
Success in digital advertising isn't measured by noise; it's measured by profit. Many agencies celebrate high impression counts, but impressions don't pay salaries. This is the critical distinction between vanity data and value-driven results. True performance lies in a clear hierarchy where surface-level numbers support bottom-line impact. At its core, PPC metrics are the diagnostic tools for your business's digital health, indicating not just activity, but genuine progress towards strategic goals.
This distinction is becoming non-negotiable. By 2026, with the full phase-out of third-party cookies complete and AI-driven bidding algorithms dominating platforms like Google Ads, the game will change. Success will no longer hinge on the sheer volume of data you collect. It will depend entirely on the quality of the signals you feed the machine. Campaigns optimized for high-quality leads, profitable sales, and high lifetime value customers will outperform those chasing clicks. Aligning your metrics with your core business objectives isn't just good practice; it's a survival strategy for the next era of digital advertising.
Think of your Key Performance Indicators (KPIs) as your campaign's North Star. They are the 2-3 core objectives directly tied to business growth. Metrics, on the other hand, are the supporting data points that explain why you are, or are not, hitting your KPIs. For example, a high Click-Through Rate (CTR) is a positive metric, but if it results in a Cost Per Acquisition (CPA) that's 50% above your target, it's a failing KPI. The metric looks good; the business result is a failure.
For a Glasgow-based business, the essential KPIs are hyper-specific to your model:
While KPIs define success, four foundational metrics build the story of every campaign. They are the essential inputs that every performance marketer must master before they can even think about advanced optimization. Understanding these is fundamental to the entire Pay-per-click (PPC) advertising model, where each element directly influences the next.
Once you’ve established visibility, the next layer of analysis focuses on efficiency. How much does it cost to capture a user's attention? These crucial ppc metrics are not just about spending less; they are direct indicators of your ‘ad-to-audience’ resonance. High efficiency means your message, targeting, and offer are perfectly aligned with user intent. While Cost Per Click (CPC) and Click-Through Rate (CTR) dominate search campaigns, don't discount Cost Per Mille (CPM). It’s experiencing a strategic resurgence, particularly for video and display campaigns on platforms like YouTube and the GDN where brand awareness is the primary objective.
CTR measures the percentage of people who saw your ad (impressions) and actually clicked on it. It’s a direct reflection of your ad copy's power and your targeting's precision. By 2026, we project a 'good' CTR for Google Search to be above 8% in niche B2B sectors, while a 2% CTR on Meta platforms will be considered strong. In Google Ads, CTR is a primary component of your Quality Score. A higher CTR signals to Google that your ad is highly relevant to the search query, which the platform rewards with a better Ad Rank and, often, a lower CPC. You can systematically boost CTR by integrating behavioral triggers: think dynamic countdown timers for sales, location insertion for local relevance, or ad copy that directly addresses a pain point identified from audience research.
CPC is the price you pay for each click. In the UK market, CPC inflation is a reality, driven by increased competition and rising operational costs. As of Q4 2023, CPCs in the legal and financial services sectors in London and Manchester frequently exceed £60 per click. Relying solely on manual bidding is no longer a viable strategy. Automated bidding like Target CPA (tCPA) or Target ROAS (tROAS) fundamentally changes how you should interpret CPC. These strategies may intentionally pay a higher CPC for a user whose data signals a high probability of conversion, optimizing for the final action, not the initial click cost. While a deep dive into strategy is available in this comprehensive guide to PPC from Forbes, a disciplined approach is key.
Lowering your average CPC without losing valuable traffic is a core challenge. The solution isn’t just bidding less; it's about increasing efficiency through strategic optimisation. Success here requires a relentless focus on data.
Mastering this balance between cost and quality is where campaigns are won or lost. We partner with clients to translate raw CPC data into scalable growth, ensuring every pound spent is an investment toward a measurable business outcome.
Clicks and impressions are vanity metrics. True campaign success is measured by its direct contribution to your bottom line. An effective strategy moves beyond surface-level data and focuses on the financial return of every dollar spent. This is where professional PPC management proves its value, transforming ad spend from an expense into a predictable growth engine. The goal isn't just to be seen; it's to generate profit.
The conversation around performance must evolve. While foundational indicators like click-through rate and conversion rate are part of the equation, they don't tell the whole story. The most sophisticated advertisers look past the standard list of essential PPC metrics to focus on what directly impacts profitability. For any business, the ultimate question is simple: is this campaign making us money?
Your business model dictates your primary profit metric. For lead generation businesses, like a B2B SaaS company or a law firm, Cost Per Acquisition (CPA) is the logical starting point. Here, the goal is to acquire a qualified lead for a cost that is significantly lower than that lead's potential Lifetime Value (LTV). A $300 CPA might seem high, but if the average client LTV is $15,000, it represents an exceptional investment.
For e-commerce, Return on Ad Spend (ROAS) is king. It provides an immediate, clear measure of revenue generated for every dollar of ad spend. Return on Ad Spend (ROAS) is the multiplier of your advertising investment. A ROAS of 5 means for every $1 spent on ads, you generated $5 in revenue. Every e-commerce manager must know their 'Break-even ROAS', calculated as 1 / Profit Margin. If your average profit margin is 25% (0.25), your break-even ROAS is 4. Any ROAS below 4 is losing money.
ROAS is powerful, but it can be deceptive. A high ROAS on a low-margin product can create the illusion of success while quietly draining your resources. This is why forward-thinking e-commerce brands are already shifting to Profit on Ad Spend (POAS). This metric moves beyond revenue and measures actual profit.
To calculate POAS, you must integrate your Cost of Goods Sold (COGS) into your performance analysis. This isn't just a marketing metric; it's a business intelligence metric. The formula, (Revenue - COGS - Ad Spend) / Ad Spend, provides an unvarnished look at profitability. It tells you exactly how much cash your campaigns are adding to your bank account. The adoption of these more advanced ppc metrics demonstrates a commitment to sustainable, data-driven growth, ensuring that every decision is based on real-world business impact, not just revenue figures.
Financial metrics tell you what you spent and what you earned. Behavioral and quality metrics reveal the 'why' behind the 'what'. These data points move beyond the click to analyze the entire user experience, from the moment a user sees your ad to the action they take on your landing page. They are the diagnostic tools that uncover friction, identify disconnects, and measure your competitive presence in the market. Without them, you’re flying blind, celebrating clicks that never convert.
A high Click-Through Rate (CTR) with a low Conversion Rate (CVR) is not a success; it's a red flag indicating a severe messaging mismatch. If your ad creative promises a 50% discount but the landing page hides the offer or makes it difficult to claim, users will leave. This disconnect between ad promise and landing page reality is a primary cause of wasted ad spend. The user clicked because they believed you had a solution. The low CVR proves your page failed to deliver on that promise.
This failure is often rooted in technical and user experience flaws. According to 2021 data from Google, a 1-second delay in mobile page load time can decrease conversions by up to 20%. A clunky, non-responsive mobile experience doesn't just frustrate users; it actively costs you revenue. These are not minor details; they are critical conversion barriers. Systematically identifying and fixing these leaky funnels is precisely what Behaviour Digital's CRO services are designed for, turning clicks into customers through data-backed user experience improvements.
Impression Share (IS) is your market share within the ad auction. An IS of 70% means your ads appeared for 7 out of every 10 eligible searches. The other 30% is your lost opportunity, which Google Ads breaks down into two critical categories:
The Auction Insights report is your competitive intelligence dashboard. It reveals which competitors are bidding on the same keywords, how frequently their ads appear above yours, and their overall impression share. A sudden spike in a competitor's Overlap Rate from 25% to 60% is an immediate signal that they've adopted a more aggressive strategy. For your own brand terms, the goal must be an impression share above 95%. Anything less means you're allowing competitors to steal high-intent customers who are actively searching for your business. Analyzing these deeper ppc metrics is fundamental to defending your market position and identifying strategic growth opportunities.
Understanding key metrics is only half the battle. Without a robust framework to interpret and act on them, data is just noise. True growth comes from converting raw numbers into strategic decisions. This isn't about creating prettier reports; it's about building a system that predictably drives profit. The right framework moves you from reactive adjustments to proactive, data-led strategy.
A successful framework is built on five core pillars:
Our reports are built for decision-makers, not data scientists. We eliminate 'fluff' metrics like impressions and focus exclusively on what impacts your P&L. While we leverage AI for automation, we believe in the irreplaceable 'Human Element'. An algorithm can't understand competitor movements or shifts in market sentiment. Our Glasgow-based strategists provide that critical context, ensuring your data analysis is enhanced by deep local market knowledge, not hindered by it.
The digital landscape of 2026 will be cookieless. An audit of your tracking and reporting setup today is essential for compliance and data integrity tomorrow. The first step is to identify the 'low-hanging fruit' in your data. We often find that a comprehensive audit can immediately unlock 15-20% of an existing budget by reallocating spend from underperforming campaigns. Stop guessing and start growing. Contact Behaviour Digital for a Data-Driven Audit and build a PPC strategy that delivers measurable results.
The paid media landscape of 2026 won't be won by the highest bidder, but by the smartest analyst. The critical shift is clear: move beyond vanity data like clicks and impressions and anchor your strategy in profitability metrics like LTV:CAC. Building a unified reporting framework isn't an administrative task; it's your strategic command center. Your ability to connect these advanced ppc metrics to tangible business outcomes is the single greatest lever for scalable growth.
This level of analysis requires a dedicated partner obsessed with your bottom line. As Glasgow-based strategic experts, Behaviour Digital specializes in translating complex data into what we call Behavioral ROI. We deliver the transparent, no-jargon reporting that empowers confident decision-making. If you're ready to transform your ad spend into a predictable growth engine, we're ready to help. Scale your business with data-driven PPC management and build the future you've planned for.
The most important metric is the one tied directly to your business objective, typically Return on Ad Spend (ROAS) or Customer Acquisition Cost (CAC). While metrics like Click-Through Rate (CTR) indicate ad relevance, they don't measure profitability. Focusing on a 5% CTR is meaningless if the resulting CAC is 50% higher than your customer's lifetime value. Success is measured by the direct, quantifiable financial return your advertising generates.
Your Cost Per Click (CPC) is too high if it prevents you from achieving your target Cost Per Acquisition (CPA) or ROAS. A $5 CPC might be a bargain in a legal niche where one client is worth $10,000, but it's unsustainable for an e-commerce store selling $25 products with a 40% margin. We analyze your entire funnel, from click to conversion value, to determine a profitable CPC threshold. It isn't about the cost; it's about the value it generates.
A "good" conversion rate is industry-specific, but we project that by 2026, top-quartile performers in e-commerce will aim for 5.5% or higher, while B2B lead generation should target 3-4%. Average rates are misleading. According to WordStream data from 2023, the median Search conversion rate was 3.17%. However, focusing on an industry average is a flawed strategy. We benchmark against your specific historical performance and competitor data to set aggressive but achievable goals.
AI-powered bidding, like Google's Smart Bidding, directly impacts efficiency metrics such as CPA and ROAS by automating bid adjustments in real-time. Instead of manual CPC changes, algorithms analyze over 70 million signals per auction to optimize for your goal. This shifts focus from micro-managing bids to strategic oversight: feeding the AI high-quality data. The result is often a 15-20% improvement in conversion volume at a similar cost.
Return on Ad Spend (ROAS) measures the gross revenue generated for every dollar spent on advertising, while Return on Investment (ROI) calculates the net profit after all business costs are factored in. ROAS is a campaign-level metric; for example, $1,000 in ad spend generating $5,000 in revenue is a 5x ROAS. ROI is a business-level metric that includes costs of goods sold and overhead. That same $5,000 in revenue might only yield a 2x ROI after all expenses.
A dropping Impression Share with a high budget is most often caused by increased competition or a decline in your Ad Rank. If new competitors enter the auction or existing ones increase their bids, the average CPC can rise, exhausting your budget faster. Alternatively, a lower Quality Score, stemming from poor ad relevance or landing page experience, can lower your Ad Rank, making you less competitive even with the same bid. We systematically diagnose these factors to reclaim visibility.
Key performance indicators like CPA and ROAS should be reviewed weekly, while tactical metrics like CTR and CPC can be monitored daily, especially during a new campaign launch. Daily checks prevent immediate budget waste from technical errors or sudden market shifts. Weekly analysis provides enough data to identify meaningful trends without overreacting to daily fluctuations. We provide clients with custom dashboards and conduct formal strategic reviews bi-weekly to ensure all ppc metrics align with business goals.
Yes, you can consolidate cross-platform PPC data into a single dashboard using specialized reporting tools like Google Looker Studio, Supermetrics, or Whatagraph. Relying on native platform reporting from Google, Meta, and LinkedIn creates data silos and prevents a holistic view of performance. We integrate these data sources into a unified dashboard. This allows for transparent comparisons of critical ppc metrics like blended CPA and total ROAS, enabling smarter budget allocation.
.png)
.png)
We help clients all over the globe grow their digital advertising campaigns. Ready to see what we can do for you? Get started with your free growth plan.
GET STARTED