

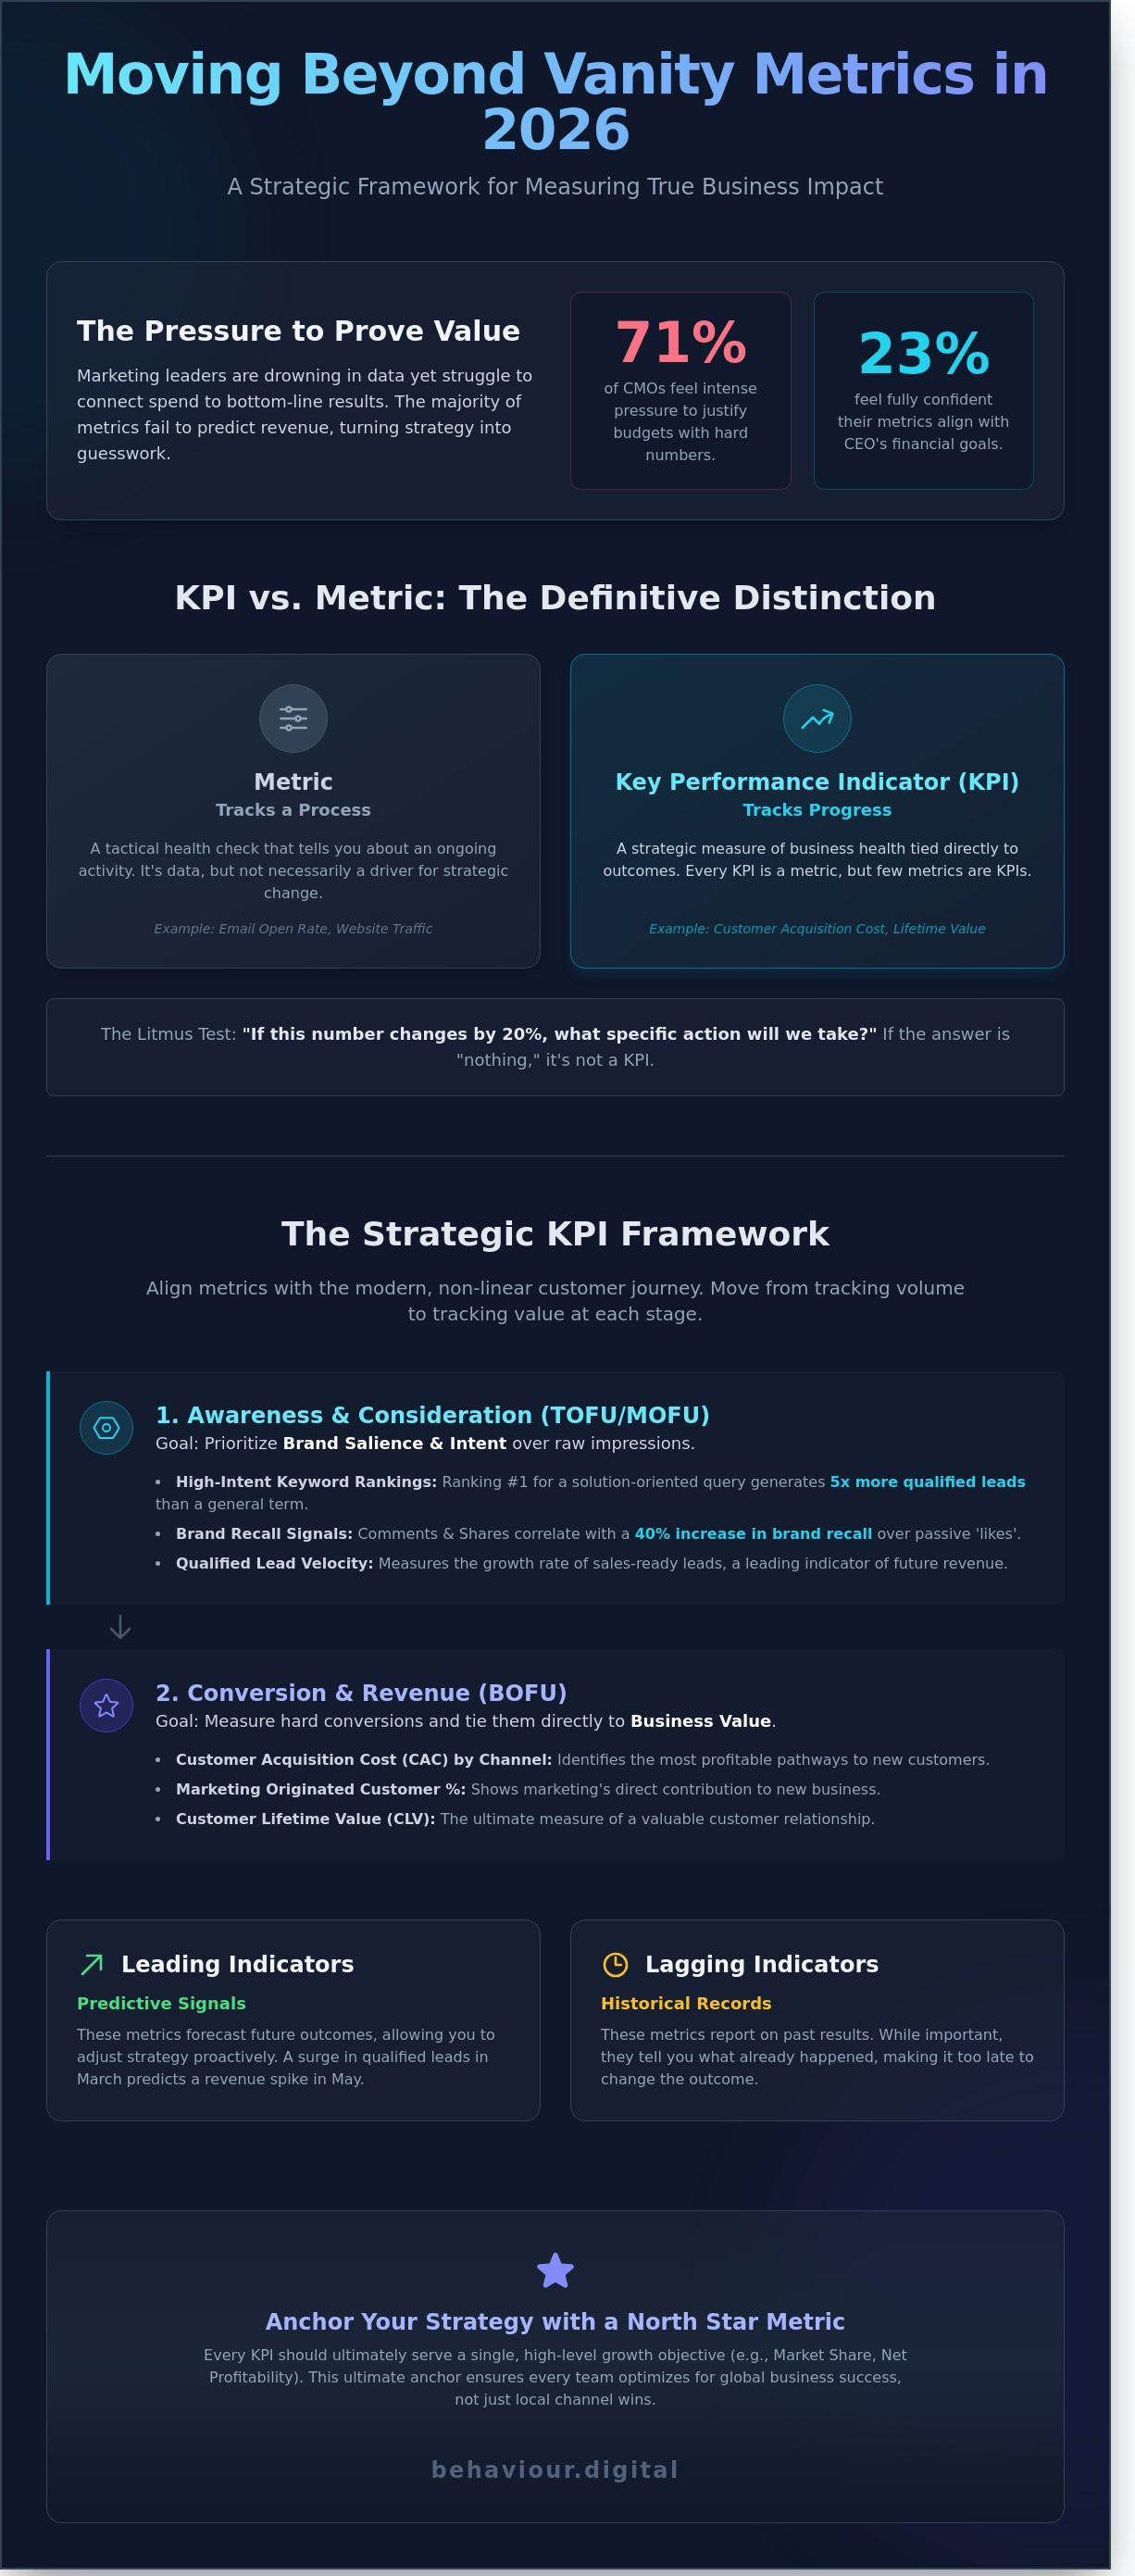
A 2024 CMO Survey found that 71% of marketing leaders feel under intense pressure to justify their budgets with hard numbers. Despite this, many still drown in data silos that obscure the real impact of their spend. Most marketing kpis today are nothing more than vanity metrics that fail to predict future revenue. If you can't link a specific campaign to a 15% increase in customer lifetime value, your strategy is essentially guesswork. Success in 2026 requires a shift from tracking activity to measuring business value.
It's frustrating to manage a complex tech stack while leadership demands total transparency on every dollar. You're right to want a clearer connection between digital behavior and the bottom line. This guide provides the framework you need to build a high performance measurement system and separate noise from value. You'll find a tiered list of metrics, a reporting structure for stakeholders, and a deep dive into using behavioral data to drive scalable growth.
• Distinguish between vanity metrics and high-value indicators to prioritize data that directly impacts your bottom line.
• Build a strategic framework that aligns marketing kpis with the modern customer journey for comprehensive funnel visibility.
• Decode user intent signals and micro-conversions to understand the behavioral "why" behind your performance data.
• Implement a five-step infrastructure to integrate CRM data and ad signals, turning fragmented data into actionable business intelligence.
• Discover how a behaviour-first approach transforms raw data into scalable growth through transparent, performance-led management.
Data is no longer a scarce resource. It's a flood. Most marketing departments in 2026 are drowning in real-time dashboards while their actual business impact remains opaque. A recent analysis of mid-market firms found that only 23% of marketing leaders feel fully confident that their chosen metrics align with their CEO's financial goals. This disconnect exists because most teams fail to distinguish between raw data and a strategic performance indicator that drives decision-making. If your data doesn't force a change in strategy, it's just noise.
Success isn't found in the volume of data you collect. It's found in the hierarchy you establish. You must align your marketing kpis with high-level business objectives like EBITDA or market share. If a campaign generates a 50% increase in traffic but results in a 10% drop in lead quality, that campaign is a failure, regardless of what the platform-level engagement metrics suggest. We focus on value, not volume. Every dollar spent must be traceable to a measurable increase in equity or revenue.
Metrics track process; KPIs track progress. Every KPI is a metric, but very few metrics deserve to be KPIs. A metric like "Email Open Rate" tells you about a process. It's a tactical health check. A KPI like "Customer Acquisition Cost (CAC) by Channel" tells you about the health of your business model. To identify if a data point is actionable, ask: "If this number drops by 20% tomorrow, what specific action will we take?" If the answer is "nothing," it's not a KPI.
These are predictive signals. A surge in "Qualified Lead Velocity" in March often predicts a revenue spike in May.
These are historical records. "Total Revenue" tells you what happened, but it's too late to change the outcome once the quarter ends.
Chasing the wrong numbers is more expensive than not measuring at all. We've seen brands destroy their overall ROAS by obsessing over lowering their CPC. They pivot toward cheaper, low-intent traffic that inflates "Session" counts but never converts. This creates a psychological trap. Marketers feel successful because their channel-level graphs are green, while the company's bank account stays red. This is the danger of vanity metrics like likes and impressions; they provide an ego boost without providing equity. They mask inefficiency and delay necessary pivots.
A North Star Metric acts as the ultimate anchor for your entire digital strategy, ensuring every tactical experiment serves a singular, high-level growth objective. Without this anchor, your team will optimize for local maximums while missing the global opportunity. Effective marketing kpis must always translate into business-level growth, moving the needle on market share or net profitability rather than just social media reach. Real growth requires the courage to ignore the noise and double down on the indicators that actually drive the bottom line.
A flat list of metrics is a liability in 2026. Traditional funnels have collapsed into a fragmented web of touchpoints. A 2023 study by Gartner revealed that 71% of B2B buyers now prefer a rep-free experience, meaning your digital presence must do the heavy lifting. Measuring marketing kpis through a linear lens ignores how users actually behave. They don't move from A to B; they loop, research, and disappear before returning to convert. Success requires a framework that categorizes metrics by the psychological state of the buyer.
Top-of-Funnel (TOFU) metrics must prioritize brand salience over raw reach. It's not about how many people saw your logo. It's about how many people remember your solution when a problem arises. Middle-of-Funnel (MOFU) tracking shifts toward intent signals. We look for active consideration. Bottom-of-Funnel (BOFU) focus remains on hard conversion and retention, but these numbers only make sense when viewed alongside the cost of the entire journey. We don't just track data; we track the momentum of the business.
Reach is often a vanity metric. A million impressions mean nothing if the audience isn't relevant. We prioritize search engine rankings for "High-Intent" keywords over broad, informational terms. Ranking #1 for a specific solution-oriented query generates 5x more qualified leads than ranking for a general industry term. Social media engagement rates must also be scrutinized. A "like" is passive. Comments and shares are active signals that correlate with a 40% increase in brand recall. This is why 7 Marketing KPIs You Should Know from Harvard Business School Online emphasizes metrics that actually reflect customer behavior rather than platform noise.
Assisted conversions are the most undervalued component of this stage. GA4 data indicates that 65% of modern conversions involve three or more touchpoints. If you rely solely on last-click attribution, you'll likely cut funding to the very channels that initiate the buyer journey. We analyze which channels serve as the "assist" to ensure the top of the funnel remains fueled. A truly data-driven strategy protects these early-stage investments because they're the foundation of future revenue.
Profitability lives in the gap between acquisition cost and lifetime value. Customer Acquisition Cost (CAC) must be calculated with surgical precision. It's not just your ad spend; it's the total marketing investment divided by new customers acquired in a specific window, such as Q3 2024. If your CAC exceeds 33% of your initial contract value, your scaling model is likely broken. We also distinguish between Return on Ad Spend (ROAS) and Marketing Efficiency Ratio (MER). While ROAS measures individual platform performance, MER provides the "blended" truth. Total Revenue divided by Total Ad Spend gives you the macro view of your spend's impact.
Useful for tactical optimization within Google or Meta ads.
The definitive metric for overall business health and scaling decisions.
The ultimate benchmark. Sustainable growth requires a CLV to CAC ratio of 3:1 or higher.
Sustainable scaling isn't a product of luck. It's the result of optimizing these ratios. When you understand the relationship between marketing kpis and long-term value, you stop "spending" on marketing and start investing in a predictable growth engine.
Raw traffic is a vanity metric. It doesn't pay bills or scale companies. At Behaviour Digital, we prioritize user intent signals over total sessions because volume without intent is just noise. High traffic means nothing if your bounce rate hits 92% within four seconds. We analyze how users interact with your digital interface to identify the specific friction points that stop growth. By focusing on behavioral data, we move beyond guessing what users want and start measuring what they actually do.
Understanding essential marketing KPIs requires looking past surface-level numbers. We track micro-conversions as the primary breadcrumbs leading to a macro-sale. A user who views your pricing page three times in 48 hours is 4.5 times more likely to convert than a casual blog reader. These small actions provide the data needed for predictive modeling. Instead of reactive reporting, we use these signals to forecast revenue and adjust budgets before the month ends.
Dwell time and scroll depth measure content resonance in a low-attention economy. In 2024, data showed that content achieving a 75% scroll depth saw a 28% higher lead quality than shallow-engagement pages. We don't just want clicks; we want engagement that proves value. Low dwell time on high-traffic pages usually indicates a disconnect between your ad copy and the landing page reality. We use these marketing kpis to bridge that gap and ensure your messaging aligns with user expectations.
We distinguish between 'Information-Seeking' and 'Solution-Seeking' behavior. A user searching for "how to fix a leak" is gathering info; a user searching for "emergency plumber near me" is looking for a solution. Tracking 'Add to Cart' clicks and 'Form Start' events serves as an early warning system for your sales funnel. If 45% of users start a form but only 8% finish it, you've got a friction problem, not a lead problem. This behavioral data informs our PPC bidding strategies in real-time. We automate higher bids for users who exhibit solution-seeking patterns, ensuring your marketing kpis reflect high-value acquisitions rather than cheap, useless clicks.
Site speed is a non-negotiable performance pillar for 2026. Current benchmarks show that a 100-millisecond improvement in load time can boost conversion rates by up to 8.4%. We treat technical performance as a core marketing metric because a slow site destroys your ROAS. Your A/B testing win rate is another critical indicator. If your experimentation program has a win rate below 20%, your hypotheses aren't grounded in enough data. Success requires a systematic approach to What is Conversion Rate Optimisation (CRO)? to ensure every site change drives measurable business impact.
Identifying where the largest percentage of users exit the funnel.
Measuring if your key value proposition is actually being read.
Pinpointing specific fields that cause users to quit.
Correlating time spent on site with lead quality scores.
User flow bottlenecks reveal exactly where you're losing money. If the drop-off rate between your product page and the checkout is 80%, your UX is actively killing your ROI. We use heatmaps and session recordings to transform these "leaks" into optimization opportunities. Marketing success is a game of marginal gains. Fixing a single bottleneck in the checkout process can increase net profit by 15% without spending an extra dollar on advertising. We focus on these hard truths to ensure your strategy is built on a foundation of reality, not hope.
Data isn't a business asset until it becomes actionable. Research shows that 68% of data within enterprises goes unused because it lacks a clear path to decision-making. To move from passive collection to aggressive growth, you need a 5-step operational framework. First, capture every signal across the customer journey. Second, clean that data to remove bot traffic and duplicates. Third, unify your CRM records with ad platform signals. Fourth, visualize the trends through automated dashboards. Finally, execute budget shifts based on those insights. This cycle turns raw numbers into a competitive advantage.
Breaking down silos is the most critical step in this process. Your ad platforms shouldn't exist in a vacuum. By integrating Salesforce or HubSpot data directly with Google Ads, you close the feedback loop. You stop measuring success by the volume of leads and start measuring by the quality of closed deals. This integration allows you to calibrate your marketing kpis toward actual revenue rather than top-of-funnel vanity metrics. It's the difference between a campaign that looks good on paper and one that actually scales the business.
Choosing an attribution model is no longer a matter of preference. Last Click attribution is obsolete because it ignores the 7 to 10 touchpoints a typical B2B buyer requires. Data-Driven Attribution (DDA) is the standard. It uses algorithmic modeling to assign fractional credit to every interaction. This provides a realistic view of how your social ads, search campaigns, and email sequences work together. To prevent stagnation, you must also set "Thresholds for Action." If a core metric drops by 15% over a 72-hour window, your team should have a pre-defined protocol to pause, pivot, or investigate. Waiting for a monthly report to catch a performance dip is a recipe for wasted spend.
GA4 is merely the entry point for modern tracking. By 2026, server-side tracking will be mandatory for any brand serious about data privacy and accuracy. This setup moves the tracking logic from the user's browser to your own server, bypassing ad blockers and improving page load speeds by up to 22%. Your reporting should be "Boardroom-Ready," meaning it translates complex marketing kpis into business outcomes like ROAS and CAC. AI now plays a vital role here, using predictive modeling to spot anomalies and forecast end-of-month performance with 94% accuracy.
Effective communication requires two distinct layers. Daily tactical checks are for the specialists who manage the accounts. Monthly strategic reviews are for the leadership team to ensure the roadmap remains valid. When presenting to a CEO, strip away the technical PPC jargon. They don't need to hear about Quality Score; they need to hear about the cost per acquisition and the velocity of the sales pipeline. Transparency is the only foundation that supports a high-stakes partnership. Radical honesty about what the data shows, even when it's uncomfortable, is what builds the necessary trust to innovate and scale.
Data without direction is noise. At Behaviour Digital, we move beyond standard reporting to implement a "Behaviour-First" methodology. This approach ensures that your marketing kpis align with actual human actions rather than just platform algorithms. We manage PPC and Social for Glasgow businesses by analyzing the friction points in the user journey. If a user clicks but doesn't convert, the platform might call it a success based on CTR, but we view it as a signal to optimize. Our performance-based management intersects digital strategy with psychological triggers. We don't just buy traffic; we engineer pathways to purchase.
Most agencies rely heavily on platform-reported ROAS. This is often a flawed metric. In 2024, privacy changes and cross-device tracking mean that Meta or Google might over-report success by 15% to 30%. We prioritize "Revenue Attributed to Marketing" as our North Star. This involves syncing your CRM data with ad spend to see exactly how many pounds reached your bank account from a specific campaign. It's about transparency. If the numbers don't match your internal accounting, the strategy needs to change. We focus on scalable growth that survives the scrutiny of a P&L statement.
Scaling a business requires a measurement framework that evolves. You can't use the same metrics for a £5,000 monthly spend as you do for a £50,000 spend. As volume increases, marginal returns often diminish. We identify the exact "tipping point" where your cost per acquisition (CPA) starts to outpace your lifetime value (LTV). By auditing your current framework, we pinpoint these inefficiencies. We typically find that 22% of ad spend in unoptimized accounts is wasted on keywords or audiences that have zero historical conversion data.
The UK market isn't a monolith. Benchmarks for PPC in Glasgow show that CPCs are often 18% lower than in London, yet the conversion intent in specific service sectors is significantly higher. We use these local nuances to help Scottish SMEs compete on a national level. By leveraging lower local costs to build high-intent audiences, we create a foundation for UK-wide expansion. Our work as a PPC Agency Glasgow: A Guide to Success demonstrates how data-driven localization leads to better marketing kpis. We've helped brands scale from local heroes to national contenders by maintaining a strict 4:1 revenue-to-ad-spend ratio during aggressive growth phases.
Automation is standard in the modern ad world, but it's not a strategy. Algorithms prioritize spending your budget; we prioritize your profit. A proactive agency partner looks beyond the dashboard to suggest business-level changes, such as adjusting price points or improving landing page load speeds by 1.5 seconds to boost mobile conversions. Your journey with us starts with a rigorous 32-point measurement audit. We examine your tracking tags, attribution models, and historical performance to build a roadmap for the next 12 months. Stop guessing which ads work. Book your free data and strategy audit today and get a clear view of your growth potential.
The 2026 landscape demands a shift from passive reporting to active intelligence. You can't rely on surface-level data when market leaders are already decoding the behavioral "why" behind every click. Success hinges on a 3-tier hierarchy of marketing kpis that bridges the gap between technical infrastructure and actual revenue. It's about building a framework where behavioral insights drive every PPC and CRO decision to ensure no budget is wasted. A robust 5-step measurement infrastructure is the only thing standing between fragmented data and a scalable growth engine.
Since 2022, Behaviour Digital has focused on replacing vague estimates with transparent results. Based in Glasgow and serving the entire UK, we specialize in converting complex data sets into clear growth trajectories. We don't believe in vanity metrics; we believe in the 20% to 35% efficiency gains that come from a performance-based approach. Our team ensures your strategy remains grounded in facts rather than assumptions.
Ready to turn your data into a growth engine? Contact Behaviour Digital today.
The tools for 2026 are ready. It's time to use them to build your competitive advantage.
The most critical marketing KPI for a small business is the ratio of Customer Lifetime Value (LTV) to Customer Acquisition Cost (CAC). You need to ensure your LTV is at least 3 times higher than your CAC to maintain a sustainable growth model. If your CAC exceeds 33% of your customer's total value, your business model faces immediate scaling risks. Focus on this metric to ensure every pound spent on marketing kpis generates actual profit rather than just revenue.
You distinguish a real KPI by its direct impact on your bottom line and its ability to trigger a specific business action. A vanity metric like "page views" or "likes" might show reach, but it doesn't correlate to revenue. If a 20% increase in a metric doesn't lead to a measurable change in profit or lead quality, it's a vanity metric. Real marketing kpis provide the data necessary for resource allocation and strategic pivots.
ROAS is no longer a standalone reliable metric in 2026 because privacy regulations and cookie deprecation have caused a 40% gap in direct attribution data. You should shift your focus to Marketing Efficiency Ratio (MER), which calculates total revenue divided by total ad spend. This holistic approach accounts for the "halo effect" of your campaigns. Relying solely on platform-reported ROAS will lead to underfunding successful channels that the system can't track accurately.
You should review your primary performance data daily to catch technical errors, but perform deep strategic analysis every 30 days. Weekly check-ins are essential for tactical adjustments like budget pacing or creative swaps. A monthly cadence allows for enough data points to identify statistically significant trends. Reviewing major strategic goals more frequently than every 4 weeks often leads to over-optimization based on noise rather than signal.
A competitive e-commerce conversion rate in the UK currently sits between 1.8% and 3.2% across most retail sectors. According to 2024 industry benchmarks, the UK average is 2.1%, though top-tier performers often exceed 5% through rigorous A/B testing. If your rate falls below 1.5%, you likely have friction in your checkout flow or a mismatch between your ad creative and landing page intent. Use these benchmarks to gauge your site's technical health.
CAC varies significantly based on your average order value and the length of your sales cycle. In the UK SaaS sector, an average CAC often exceeds £150, while retail e-commerce brands typically aim for a CAC between £15 and £40. These differences reflect the complexity of the buyer's journey. You must benchmark your costs against direct competitors within your specific vertical to determine if your spending is efficient or wasteful.
You don't need enterprise software to track your performance effectively; Google Looker Studio paired with GA4 provides 90% of the necessary insights for free. These tools allow you to build automated dashboards that pull data directly from your ad platforms and website. While enterprise solutions offer advanced predictive modeling, a well-configured spreadsheet and free analytics tools are enough to drive a 25% increase in marketing efficiency through better visibility.
You must immediately conduct a three-step root cause analysis starting with external market factors, followed by channel-specific performance, and ending with on-site conversion friction. Don't panic and slash budgets; instead, isolate the specific stage of the funnel where the drop occurs. If your click-through rate is stable but conversions are down 15%, the issue is likely your landing page or offer. Data-driven adjustments beat emotional reactions every time.
.png)
.png)
We help clients all over the globe grow their digital advertising campaigns. Ready to see what we can do for you? Get started with your free growth plan.
GET STARTED