

Your conversion rate is probably wrong.
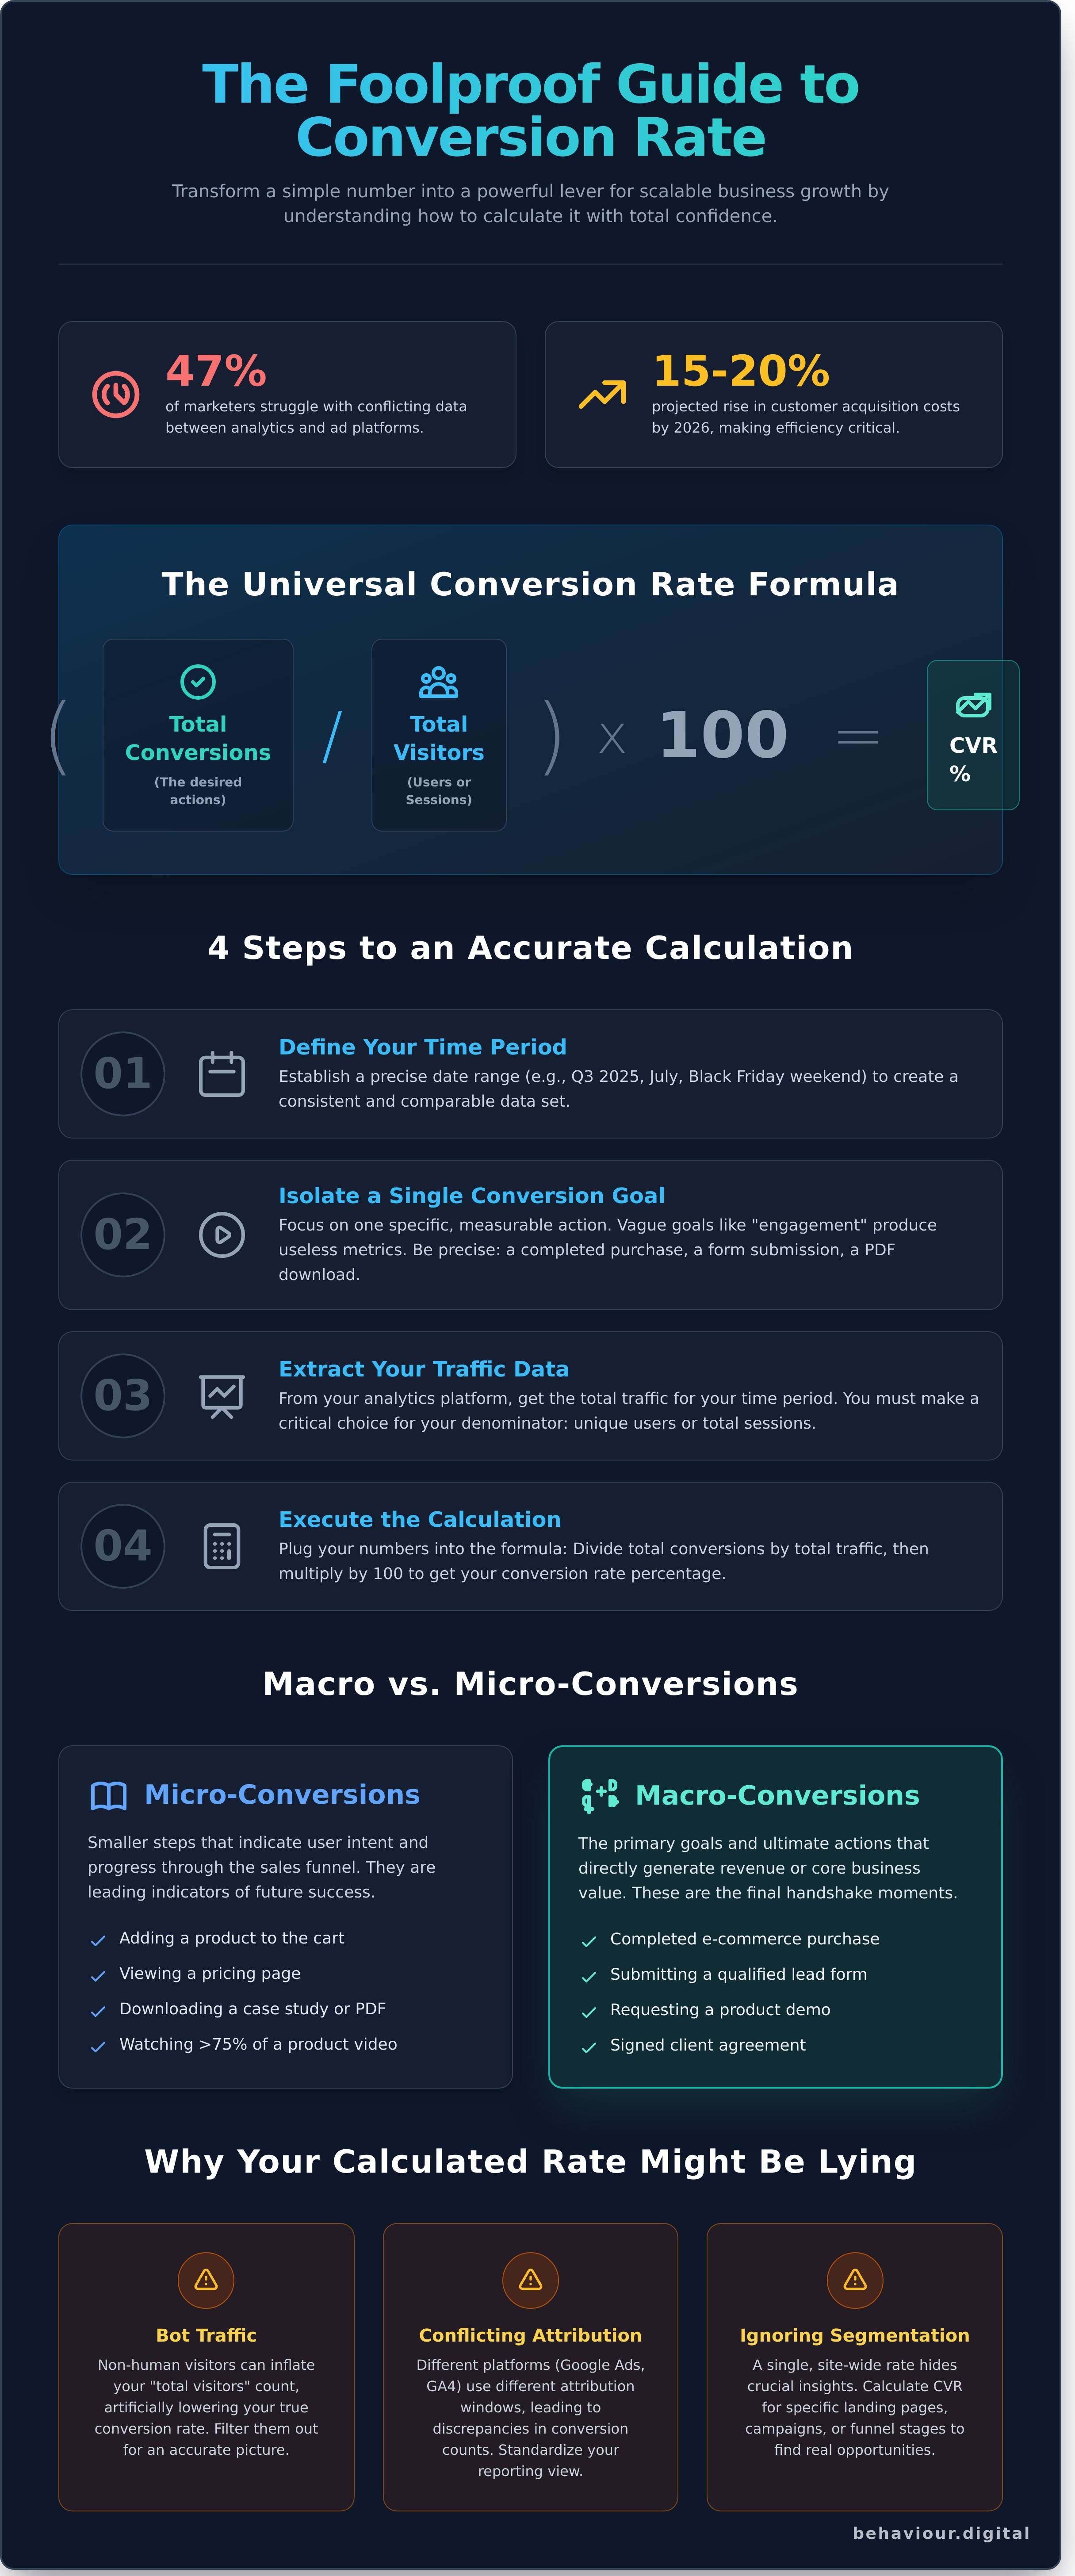
It's a common problem. In fact, a 2024 HubSpot report found that 47% of marketers struggle with conflicting data between their analytics and ad platforms. This leads to confusion over using sessions versus users for the calculation and the nagging uncertainty of what a "good" rate even looks like. This isn't just a reporting headache; it's a strategic blind spot that costs real revenue.
This guide removes the guesswork. We'll provide the exact, foolproof formulas you need to calculate conversion rate with total confidence. You will learn to diagnose the most common data pitfalls and, most importantly, transform this single metric from a simple number into a powerful lever for scalable business growth.
We'll break down the core calculations, show you how to choose the right metric for any business goal, and give you a framework for reporting that inspires decisive action from your stakeholders.
Let's be direct. Raw traffic is a vanity metric. In a digital ecosystem where, by 2026, customer acquisition costs are projected to rise by another 15-20%, focusing on website visitors alone is an obsolete strategy. Your business doesn't run on clicks; it runs on profitable actions. This is where your conversion rate (CVR) becomes the single most critical performance indicator.
It measures efficiency. It dictates profitability. It directly impacts your Return on Ad Spend (ROAS). A high CVR means your marketing spend is working harder, turning potential interest into measurable business value. A low CVR signals a critical disconnect between your offer and your audience. At its core, conversion rate is the ratio of successful user actions to the total number of opportunities. Understanding how to calculate conversion rate is the first step toward data-driven growth, but first, you must define exactly what you're measuring.
A "conversion" isn't a universal constant. It's a specific, valuable action that you define in alignment with your business objectives. Misdefine the goal, and you'll measure the wrong outcome. To build a meaningful metric, you must define two components: the action and the audience.
Your definition must be precise. An e-commerce site's primary conversion is a sale. A SaaS company's might be a demo request. Aligning your definition of a conversion with a tangible business goal is the non-negotiable foundation for any meaningful analysis.
This applies even to service-based local businesses. For a community pharmacy, a key conversion goal isn't a one-time purchase but a recurring action that builds loyalty. A great example of such a conversion goal is when patients explore Prescription Refills online, a metric that directly measures service convenience and patient retention.
This principle applies universally, from large retailers to individual creators. For those building a business around digital products, like Etsy printables or online courses, understanding the conversion path from a piece of content to a sale is crucial. To see how this audience is served with specific planning tools, you can visit Living the Hustle.
Not all conversions carry the same weight. A sophisticated digital strategy tracks the entire user journey, not just the final destination. This requires differentiating between two types of conversions: macro and micro.
Macro-conversions are the primary goals, the ultimate actions that generate revenue or core business value. Think of the final handshake. For a Glasgow-based e-commerce store, this is a completed purchase. For a financial advisor, it's a signed client agreement. These are the outcomes that directly justify your marketing investment.
Micro-conversions are smaller steps a user takes that signal progress and intent. They are leading indicators that a user is moving through your sales funnel. Examples include adding a product to the cart, viewing a pricing page, downloading a case study, or watching more than 75% of a product video. Tracking these smaller commitments provides a granular view of user behavior and identifies potential friction points. This detailed tracking is the foundation of What is Conversion Rate Optimization (CRO), a systematic process for improving website performance. By monitoring both, you gain a complete, actionable picture of your digital performance, transforming your website from a simple brochure into a predictable growth engine.
The math is simple. The power is in the precision. At its core, the universal formula to calculate conversion rate is straightforward, providing a clear metric for performance. Don't let its simplicity fool you; the value of this KPI is determined entirely by the quality of the data you use.
The Universal Conversion Rate Formula:
(Total Number of Conversions / Total Number of Visitors) x 100 = Conversion Rate (%)
To apply this formula correctly and derive meaningful business intelligence, follow this exact four-step process. Accuracy here is non-negotiable.
The choice between users and sessions is a strategic one that directly impacts the story your data tells. A session-based calculation is ideal for e-commerce, where a customer might visit multiple times before purchasing; it measures the effectiveness of each visit. A user-based calculation is superior for B2B lead generation with long sales cycles, as it measures your ability to convert a unique person, regardless of how many times they visited. Since its 2023 rollout, Google Analytics 4 tracks both, offering dedicated reports for "user conversion rate" and "session conversion rate".
Abstract formulas only become powerful when applied to real-world business scenarios. Let's ground this with two common examples:
This same logic applies at a more granular level. An effective analysis doesn't just look at the site-wide average; it isolates variables. For instance, if a Google Ads campaign drove 1,500 sessions resulting in 45 sales (3% CVR), while a Meta campaign drove 3,000 sessions for 30 sales (1% CVR), you have a clear, data-backed insight for budget allocation. Dissecting this data is where our performance marketing strategies reveal opportunities for scalable growth.
Once you have a clear, accurate baseline, the real work begins. Calculation is the diagnostic tool; optimization is the cure. Knowing your numbers allows you to test hypotheses and measure their impact systematically. There are many proven tips to help you increase your conversion rate, from refining your call-to-action to improving site speed, but it all starts with a reliable metric to guide your efforts.
A single, site-wide conversion rate is a starting point. Nothing more. Relying on it exclusively is like judging a business's health by its front door traffic; it ignores what happens inside. This one number is often a vanity metric, masking critical performance gaps and successes within your user journey. True, scalable growth comes from dissecting this average into meaningful, actionable components.
Data-driven strategy demands precision. For instance, knowing that your overall conversion rate is 3% is far less useful than knowing your desktop conversion rate is 5.8% while your mobile rate is a dismal 1.2%. This single insight, backed by analytics data, instantly shifts focus from "we need more traffic" to "we must fix our mobile user experience." The same logic applies to every segment of your funnel.
Start by analysing key interaction points:
Not all traffic is created equal. To optimise budget and effort, you must understand how each channel performs independently. Your paid search budget demands a clear return on investment. Calculating your PPC conversion rate isn't just a metric; it's the justification for your PPC Glasgow investment. A 4% CVR on a campaign provides a concrete Cost Per Acquisition (CPA) to measure against customer lifetime value. Similarly, for social media, you must measure the transition from a passive scroll to an active conversion, while email CVR reveals the effectiveness of your offer, separate from the open rate.
Beyond the "what" is the "when." Funnel velocity measures the average time it takes for a user to move from first contact to conversion. But the real power comes when you calculate conversion rate between each distinct funnel stage. If 500 visitors become 50 leads (10% CVR), but only 2 of those leads become Marketing Qualified Leads (MQLs) (4% CVR), you’ve found a major leak. The problem isn't attracting visitors; it's your lead qualification process. This granular analysis is how we pinpoint the exact "leaky" spots in your Scottish business funnel, turning potential losses into predictable revenue.
You have a number. You followed the formula, and now you have a percentage. The problem is, that number is almost certainly wrong. Raw data is not clean data. Before you build a strategy around a potentially flawed metric, you must understand the hidden variables that distort your true performance.
The number you see in your analytics dashboard is the beginning of the conversation, not the conclusion. It’s an output riddled with noise from automated bots, conflicting attribution models, and statistically insignificant sample sizes. A 5% conversion rate might actually be 7% once you filter out non-human traffic. Conversely, a campaign that Meta Ads claims generated 50 sales might only be credited with 20 in Google Analytics. Neither platform is lying; they are just speaking different languages.
In a world of vanity metrics, data transparency is the only antidote to misleading percentages.
The digital landscape is actively working against simple calculations. Since the full phase-out of third-party cookies in late 2024, tracking user journeys has become exponentially harder. Cookie consent banners, now a legal necessity under UK GDPR, mean that up to 25% of your users may be untrackable, creating significant gaps. A user might click an ad on their iPhone during their commute and complete the purchase on their desktop at home; without robust server-side tracking, you'll never connect the dots. To properly calculate conversion rate with confidence, you must first clean your data by filtering internal IP addresses, enabling GA4's bot filtering, and excluding all traffic from staging environments.
Stop chasing industry averages. While benchmarks, like the 1.7% average UK e-commerce rate reported by IRP Commerce, are useful for initial orientation, they are not a meaningful target. Context is everything. A business selling £15 t-shirts will naturally have a higher conversion rate than one selling specialized items like high-performance brake systems, and both differ from a business selling £15,000 enterprise software. To see an example of a niche e-commerce specialist in action, you can find out more. Your goal isn't to match an arbitrary number. It's to be better than you were last month. Focus on incremental, sustainable growth. That is the metric of a healthy business.
Cleaning, segmenting, and interpreting this data requires a level of precision that goes beyond standard dashboard reporting. If your numbers seem unreliable or fail to explain your business performance, let our data strategists find the truth in your analytics.
The formula is simple. The application is complex. Once you know how to calculate conversion rate, you've established a baseline. This number isn't a final score; it's the starting line for systematic growth through disciplined Conversion Rate Optimisation (CRO). The goal shifts from reporting a metric to actively improving it.
Your conversion data is a map pointing to your highest-impact opportunities. A 60% bounce rate on a key landing page isn't a failure; it's a clear signal for A/B testing. A 2.5% conversion rate for mobile users versus 5% for desktop users demands a mobile-first redesign. Prioritise tests where the data shows the biggest leaks in your funnel. This data-driven approach removes guesswork and focuses resources where they will generate the highest return.
To secure buy-in, translate conversion rates into financial terms. Don't report "We improved CVR from 1.5% to 1.8%." Instead, present it as: "This 0.3% point increase will generate an additional £75,000 in revenue this quarter from the same marketing budget." This directly connects to Customer Acquisition Cost (CAC). Every conversion you gain without increasing ad spend effectively lowers your CAC. Doubling your conversion rate from 2% to 4% means you acquire twice the customers for the same cost, effectively halving your CAC. This is the language of business growth.
Your conversion rate, when paired with traffic volume, dictates your next strategic move. It tells you where the primary bottleneck is. The raw percentage is the "what"; qualitative tools provide the "why".
DIY analysis can establish your baseline, but scaling requires specialised expertise and resources. You've outgrown internal efforts when your A/B tests fail to reach statistical significance or when your team lacks the dedicated time to move from data analysis to implementation. This is the inflection point for engaging professional CRO services. At Behaviour Digital, we manage this entire process for ambitious Scottish brands. We don't just calculate conversion rate; we build data-driven systems that connect user behaviour to tangible business results, ensuring every decision is calibrated for maximum impact.
This principle of leveraging expert support holds true globally. For instance, businesses in the Australian market often turn to agencies like Octopus Digital, and in Asia, many partner with specialists like Digitalix to implement similar data-driven strategies for growth.
The data is your foundation. A strategic partner builds the growth engine on top of it.
Ready to grow? Let us audit your conversion path today.
You now possess the tools to accurately calculate conversion rate. But remember, the formula is just the starting line. A single, site-wide metric can obscure the truth; genuine insight emerges from segmenting user data and analyzing the entire conversion funnel, from the first click to the final sale. This granular view is the difference between simply tracking performance and actively engineering growth.
Turning these calculations into scalable revenue is our core focus. As Glasgow-based specialists in data-driven growth, our team has delivered transparent strategies with measurable PPC and Social Media ROI since our founding in 2022. We believe success isn't an accident; it's the direct result of a meticulous, performance-based approach that connects user behaviour to business outcomes.
Ready to see what a dedicated growth partner can uncover in your data? Request a Free CRO Audit from Behaviour Digital and get an actionable blueprint for increasing your conversions. The path to predictable, data-backed growth starts now.
A good e-commerce conversion rate for a UK business typically falls between 2% and 4%. However, this is just a benchmark. According to IRP Commerce data from Q1 2024, the average was 2.1%. Your ideal rate depends heavily on your industry, product price point, and traffic source. For instance, to see how a niche UK retailer structures its high-conversion promotional pages, you can visit Discount Hydro. The most valuable goal isn't hitting a generic industry average; it's achieving consistent, data-driven growth against your own historical performance. Focus on incremental improvements.
In Google Analytics 4, you don't perform a manual calculation. Instead, you access the "Session conversion rate" and "User conversion rate" metrics directly within your reports. First, you must configure key events, like a purchase or form submission, as official "Conversions" in the Admin section. Once set up, you can find your conversion rates by navigating to Reports > Engagement > Conversions. This provides an automated way to track performance against your defined goals.
Discrepancies between Facebook Ads and your analytics are caused by different attribution models. Facebook, by default, uses a 7-day click and 1-day view attribution window, meaning it takes credit for a sale if a user even saw an ad and converted a day later. Google Analytics typically uses a last-click model, attributing the conversion to the final touchpoint. Post-iOS 14 privacy changes have also increased these data gaps by limiting cross-platform tracking capabilities.
Yes, you can calculate an offline conversion rate by connecting a digital action to an in-person purchase. A common method is to issue unique, trackable coupon codes through a specific online campaign. Customers then redeem these codes in-store. The formula is (Offline Redemptions / Total Campaign Clicks) * 100. This requires integrating data from your point-of-sale (POS) system with your digital campaign analytics to create a complete performance picture.
Click-through rate (CTR) measures initial interest, while conversion rate measures final action. CTR tells you the percentage of people who clicked your ad or link after seeing it (Clicks ÷ Impressions). It reflects the effectiveness of your creative and copy. Conversion rate tells you the percentage of visitors who completed a desired goal, like a purchase, on your website (Conversions ÷ Sessions). A high CTR with a low conversion rate often indicates a disconnect between your ad's promise and your landing page's experience.
Page load speed has a direct, negative impact on your conversion rate. Delays cause user frustration and site abandonment before a conversion can even happen. A 2022 study by Portent found that conversion rates drop by an average of 4.42% for every additional second of load time. A site loading in 1 second converts nearly three times better than a site loading in 5 seconds. Slow speeds increase your bounce rate, shrinking the pool of potential customers.
Your reporting frequency should match your business cycle and traffic volume. For high-traffic e-commerce sites, weekly analysis is essential for spotting trends and reacting quickly. For B2B businesses with longer sales funnels or lower traffic, monthly reporting provides more statistically significant data. Daily checks are useful for monitoring major campaign launches or technical changes, but avoid making strategic decisions based on short-term fluctuations.
The most common mistake is using an incorrect denominator, typically counting total visits instead of sessions or unique users. A single user might visit your site five times before making one purchase. If you divide that one conversion by five visits, your rate appears artificially low. The standard for e-commerce is to use sessions (Conversions ÷ Sessions). Choosing the wrong metric gives you a flawed understanding of your website's actual performance and efficiency.
.png)
.png)
We help clients all over the globe grow their digital advertising campaigns. Ready to see what we can do for you? Get started with your free growth plan.
GET STARTED