

Your performance marketing channels are working in silos. It’s costing you more than just a high CPA; it’s a fundamental blind spot that prevents effective customer journey mapping and systematically erodes your potential ROI.
You see this fragmentation every day. Your Google Ads data tells one story, your Meta Ads analytics tell another, and the real reason users abandon their cart remains a mystery buried between platforms. It’s a frustrating cycle of optimizing individual channels while the bigger picture, the actual customer, gets lost. This is where most growth stalls.
This guide is designed to break that cycle. We’ll show you how to transform abstract user paths into a data-driven blueprint for scaling PPC, Paid Social, and Conversion Rate Optimization in 2026. We'll move beyond vague personas to build actionable maps that unify your data, align ad creative with landing page intent, and ultimately build a more profitable lifecycle for every customer you acquire.
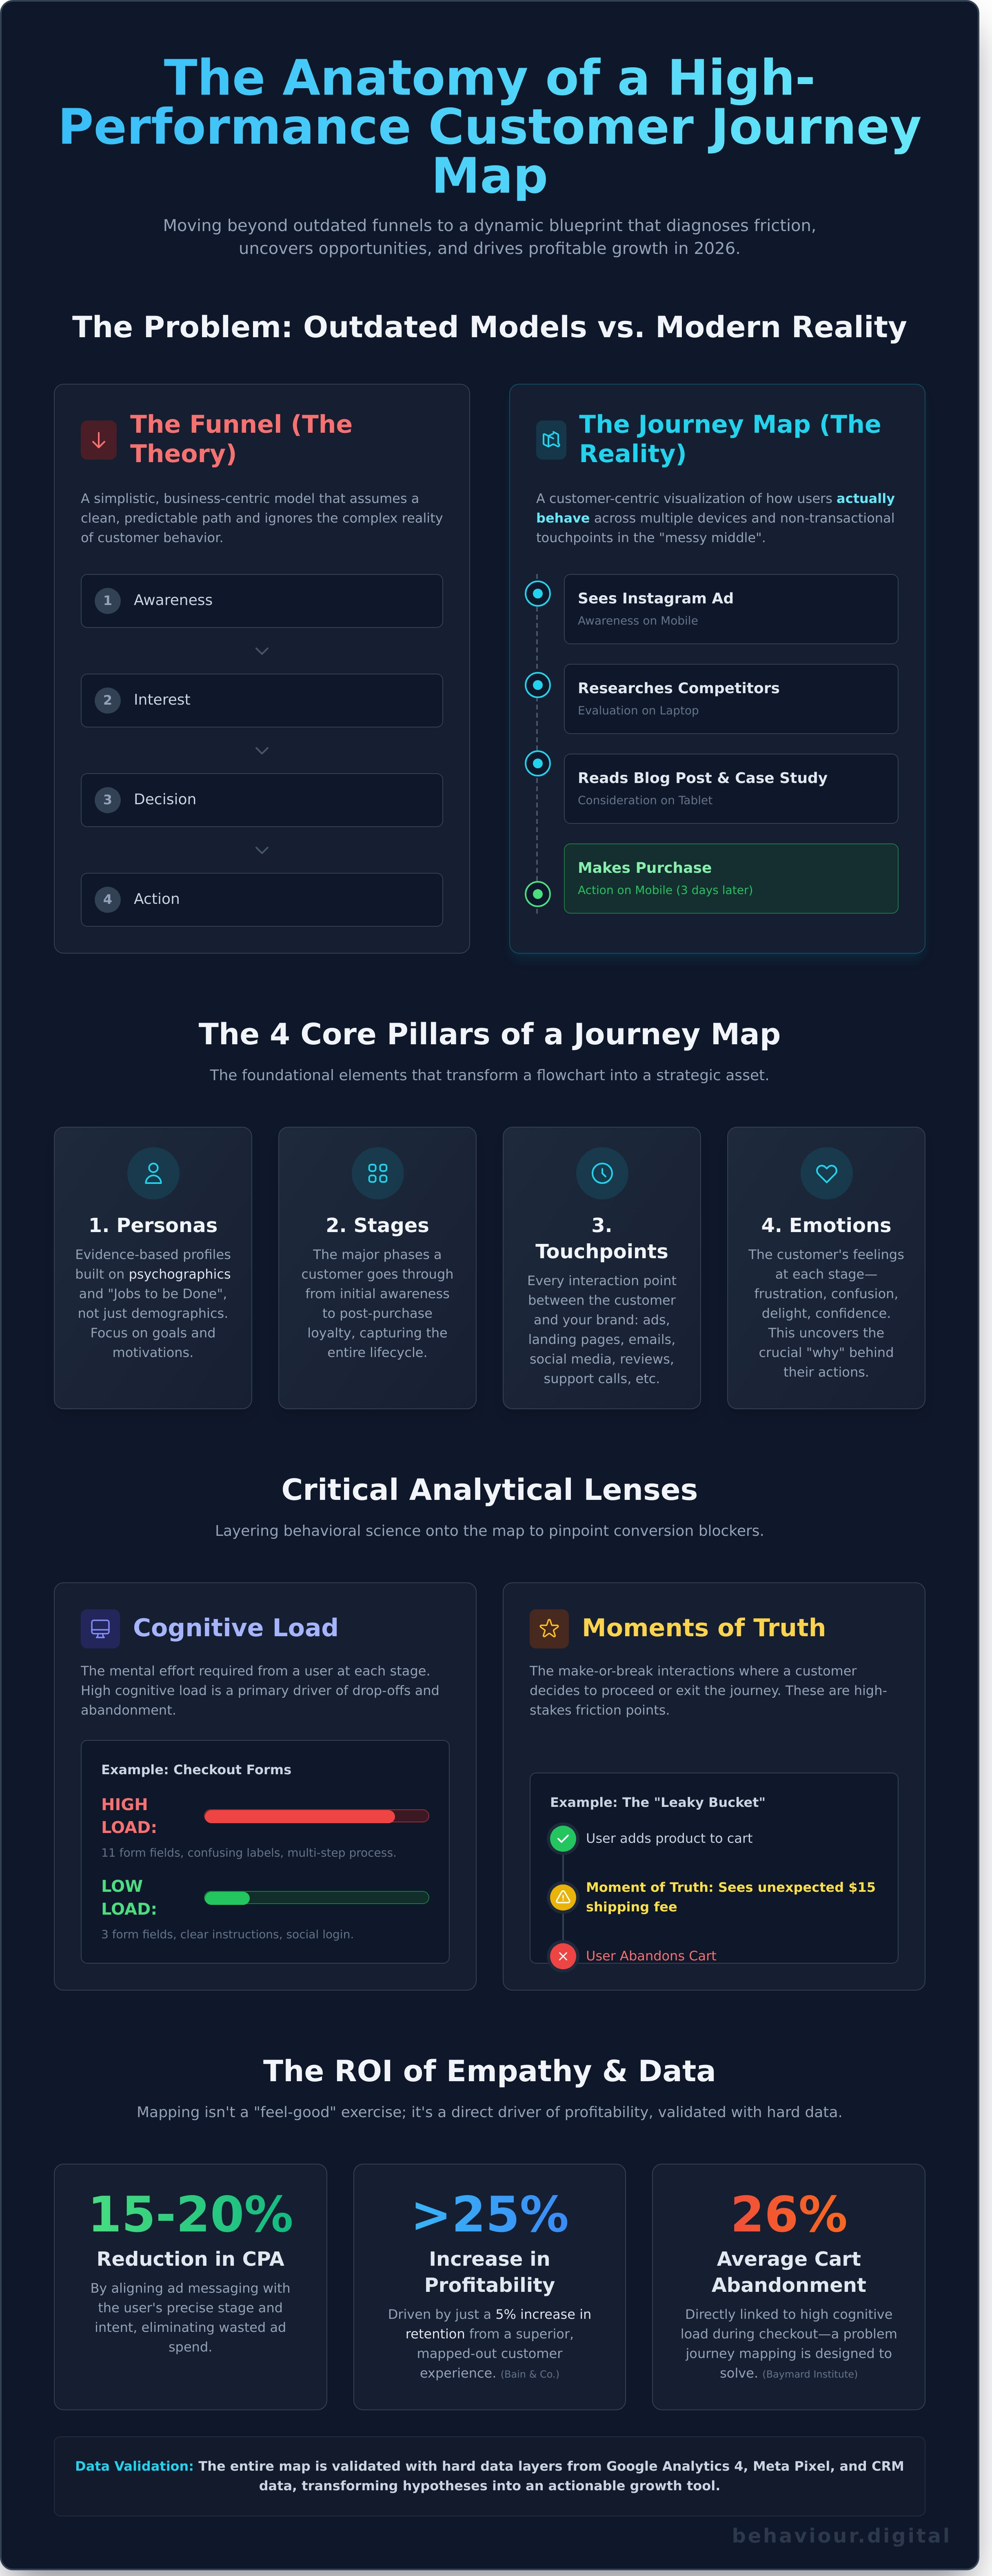
Forget static flowcharts. By 2026, the customer journey map is your primary strategic diagnostic tool. It’s not a simple diagram; it’s a dynamic blueprint that visualizes every interaction a potential customer has with your brand, from the first flicker of awareness to post-purchase loyalty. This practice of customer journey mapping is a core component of managing the total customer experience, moving far beyond outdated, linear models.
The classic sales funnel is broken. It assumes a clean, predictable path: Awareness → Interest → Decision → Action. This model fails to account for today's multi-device, non-linear reality. A customer might see your ad on Instagram during their commute, research competitors on a laptop at work, read reviews on a tablet that evening, and finally make a purchase on their phone three days later. The funnel sees none of this nuance. It only sees a lead that appeared out of nowhere.
In high-competition sectors, relying on "gut feeling" is a direct path to burning capital. In the Glasgow retail market, for instance, assuming you know what drives a shopper to choose you over a competitor on Buchanan Street is a losing bet. The same applies to B2B technology; a sales cycle involving five different decision-makers across three months can't be navigated with intuition. Data-driven mapping uncovers the friction points, motivations, and questions at each stage. It bridges the critical gap between raw analytics (the what) and the human behavior driving those numbers (the why).
Understanding your customer's journey isn't just a feel-good exercise; it's a direct driver of profitability. By aligning your messaging with the user's precise stage and intent, you eliminate waste. This clarity routinely leads to a 15-20% reduction in Cost Per Acquisition (CPA) because you stop paying for ads that don't match the user's mindset. A user searching for "SaaS security compliance checklist" isn't ready for a "Book a Demo" ad. Targeting them with one is wasted spend. Mapping reveals these intent mismatches, directly impacting your bottom line and boosting long-term Customer Lifetime Value (LTV). A 5% increase in retention, driven by a better experience, can increase profitability by over 25%, according to research by Bain & Company.
This principle of mapping a person's journey extends beyond commerce into vital human services. For instance, a provider such as an NDIS speech therapist Melbourne must meticulously map a client's path through the support system to deliver effective and timely care, demonstrating the universal importance of understanding an individual's needs at every stage.
Similarly, a modern medical weight loss program like foundry must map a patient's entire journey, from their initial health concerns to achieving long-term wellness goals, ensuring support is perfectly timed and effective.
A funnel is a business-centric model of how you want customers to act. A journey map is a customer-centric visualization of how they actually behave. This distinction is everything. Traditional funnels are too simplistic; they completely ignore what Google calls the "messy middle" of the buying process, where customers explore, evaluate, and deliberate. Journey maps are designed to capture this complexity. They identify crucial non-transactional touchpoints, like reading a blog post, watching a testimonial video, or engaging with a case study on LinkedIn. These actions don't generate immediate revenue, but they are the foundational moments where trust is built and the final conversion is earned.
A customer journey map is not a decorative flowchart. It’s a strategic asset, a data-backed visual representation of the customer experience that systemically identifies friction and uncovers revenue opportunities. A high-performance map moves beyond assumptions and is built on four core pillars: Personas, Stages, Touchpoints, and Emotions. We don’t just map what we think customers do; we prove it with data.
This framework is then layered with two critical analytical lenses. First, we analyze Cognitive Load-the mental effort a user must expend at each stage. A checkout process with 11 form fields creates high cognitive load, directly correlating to the 26% average cart abandonment rate reported by Baymard Institute. Second, we pinpoint "Moments of Truth", the make-or-break interactions where a customer decides to proceed or exit. The moment a user sees an unexpected shipping fee is a classic, high-stakes moment of truth. Finally, the entire structure is validated with hard data layers from Google Analytics 4 and Meta pixel, transforming the map from a hypothesis into an actionable growth tool.
Generic personas are worthless. Moving beyond demographics, we build profiles based on psychographics and the "Jobs to be Done" framework. We don't care that "Marketing Mike" is 34; we care that he needs to generate 50 qualified SQLs before the end of Q2. We build these evidence-based personas by analyzing CRM data from your top 15% of clients and GA4 audience reports. This avoids the trap of the "Idealized Persona," a fictional character who has no budget constraints and never encounters technical issues. Real customers face friction; your personas must reflect that reality.
Customers don't operate in silos. Their journey is a complex interaction between paid, owned, and earned media. A typical path might start with a LinkedIn ad (PPC), lead to a Google search for your brand (Direct), and be validated by a G2 review (an "invisible" touchpoint). A 2023 BrightLocal study confirmed that 98% of consumers use the internet to find information about local businesses, underscoring the power of these third-party mentions. Accurately tracking this journey requires a performance-focused analytics setup to attribute value correctly. We categorize these touchpoints by user intent to optimize our response:
A customer journey map is not a static document; it's a dynamic tool for driving measurable growth. Its value isn't in its visual appeal but in the data-driven process used to create it and the strategic actions it enables. Effective customer journey mapping is a systematic exercise in diagnosing problems and engineering solutions. Here is the five-step framework we use to transform user behavior data into a predictable conversion roadmap.
Step 1: Set clear, measurable goals for the mapping exercise.
Before you draw a single box or arrow, define what success looks like in numerical terms. Vague goals like "improve user experience" are useless. A precise goal is actionable. For example: "Reduce shopping cart abandonment from 35% to 25% in Q3" or "Increase free trial sign-ups originating from blog content by 15% within 60 days." These targets dictate the focus of your entire analysis.
Step 2: Gather qualitative and quantitative data.
Assumptions kill conversions. Your map must be built on a foundation of real user data, not internal beliefs. This requires a dual-pronged approach that combines hard numbers with human context.
We use Conversion Rate Optimization (CRO) tools like Microsoft Clarity or Hotjar to gather quantitative data. Session recordings and heatmaps show us precisely what users are doing and where they drop off, for instance, revealing that 60% of users abandon the checkout process at the shipping information stage. Simultaneously, customer interviews and surveys provide the qualitative why. An interview might reveal the reason for the drop-off is confusing shipping options. We also leverage PPC search term reports, which show the exact queries users type before they even reach your site, exposing their initial intent and questions.
Step 3: Plot the current state journey (warts and all).
Now, you must honestly document the customer journey as it exists today. This isn't the journey you designed in a boardroom; it's the often-chaotic path users actually take. It includes every frustrating dead-end, every confusing navigation element, and every unexpected detour. Accurately plotting this reality is a core component of understanding What Is a Customer Journey Map? in a practical, business-focused sense. This step exposes the disconnect between your intended process and the user's actual experience.
Step 4: Identify friction points and "leaks" in the conversion path.
With the current journey mapped, you can systematically analyze it for opportunities. This is where you connect the data from Step 2 to the touchpoints in Step 3 to pinpoint exactly where and why you are losing potential customers.
On your map, use a simple color-code system (e.g., red for high-friction, yellow for moderate) to highlight areas causing user frustration. Identify "content gaps" where users need more information to move forward; if analytics show users leave a product page to search for "product comparisons," you have a gap. Critically, map the "hand-off" between departments. If a marketing-qualified lead takes 48 hours to be contacted by sales, that's a major leak in your funnel.
Step 5: Design the future state and create an optimization roadmap.
The final step in any successful customer journey mapping project is creating an action plan. Based on your analysis, design an ideal "future state" journey that eliminates the friction points you identified. This isn't a wish list. It's a prioritized roadmap of tests and initiatives based on potential impact and implementation effort. A small change to simplify checkout fields (low effort, high impact) should be prioritized over a complete homepage redesign (high effort, uncertain impact). This roadmap turns insight into revenue; to see how this process can also help build a purpose-led brand legacy, click here for more details.
A high click-through rate (CTR) with a low conversion rate is a classic symptom of a leaky marketing bucket. You're successfully attracting attention but failing to capture value. The problem isn't the ad; it's the disjointed experience that follows. A meticulously built customer journey map acts as your diagnostic tool, moving beyond surface-level metrics to reveal the precise points of friction where potential customers abandon their path.
Your map quantifies the user's emotional state and intent at each stage. An ad that generates clicks by promising a quick solution might resonate with a user in the "Problem Aware" phase, but if it leads to a complex, jargon-filled landing page, the user's feeling of hope quickly turns to frustration. This is the disconnect. Auditing your ad creative against the map allows you to align your message with the user’s mindset. For a user in the early, "overwhelmed" research phase, your ad creative should offer clarity and education, not a hard sell. For a user in the "analytical" consideration phase, creative that showcases feature comparisons or ROI data is far more effective.
This leads directly to the "Landing Page Gap," a primary cause of wasted ad spend. According to a 2023 Unbounce report, a severe mismatch between ad promise and landing page experience can slash conversion rates by over 90%. Your journey map provides the blueprint for a seamless transition. If the user clicks an ad targeting an awareness-stage query, the destination must be an educational blog post or a downloadable guide, not a "Buy Now" page. The goal is to match the asset to the intent, building trust instead of demanding a premature commitment.
Finally, the map transforms your retargeting from intrusive to genuinely helpful. Instead of indiscriminately showing the same product ad to every site visitor, you can build logical sequences. A user who read a blog post (Awareness) can be retargeted with a relevant case study video (Consideration). A user who watched 75% of that video can then be served an offer for a free demo (Decision). This is strategic, respectful, and highly effective marketing.
A granular understanding of the user journey allows for a surgical approach to PPC. Broad match keywords are best reserved for top-of-funnel Awareness campaigns, capturing users exploring a problem. As users move to Consideration and Decision, your strategy should shift to precise Phrase and Exact match keywords, targeting high-intent, solution-focused searches. A detailed journey map stops you from wasting budget on broad, top-of-funnel keywords that attract researchers, not buyers. Use ad extensions like sitelinks to serve multiple needs simultaneously, offering links to "Case Studies" or "Pricing" directly from a single high-intent ad.
On social platforms, users are passive consumers, not active searchers. Your goal is to interrupt their scroll with content that sparks a transition from passive interest to active consideration. A journey map helps you design creative sequences that mirror this micro-funnel. For example, a campaign could start with a short video highlighting a common pain point. Viewers are then retargeted with a carousel ad detailing a solution, effectively warming a cold audience for a future, higher-intent conversion on another channel. Data from a 2022 Meta study confirmed that users exposed to brand ads on their platforms were 15% more likely to convert from a subsequent search ad.
Your paid campaigns are likely leaking profit at unseen friction points. Let our team use data-driven customer journey mapping to identify and repair these gaps. Request a comprehensive performance audit today.
A customer journey map is more than a flowchart. It’s a strategic blueprint for revenue growth. But a blueprint is only valuable when it’s used to build something. At Behaviour Digital, we don’t just deliver a document; we implement a system of continuous, data-driven optimization that transforms insights into measurable financial results. Our process is built on a simple, powerful equation: Quantitative Data + Behavioural Insight = Profitable Action.
We begin by connecting the dots. The map reveals the friction points, the moments of hesitation, and the opportunities for delight. These insights don't sit in a report. They are immediately integrated into our monthly PPC and Social Media management. For example, if our analysis shows a 60% drop-off rate between the ‘Consideration’ and ‘Decision’ stages, we don't just guess why. We use the map's qualitative data to understand the user's unanswered questions at that stage. The immediate action? We reallocate a portion of the ad budget from top-of-funnel awareness campaigns to hyper-targeted mid-funnel content, such as testimonial videos or detailed comparison guides, served directly to that hesitant audience segment.
Every insight from the map becomes a testable hypothesis. We use rigorous A/B and multivariate testing to validate our assumptions, removing guesswork from the equation. A hypothesis might be: "Users are abandoning carts because the shipping costs are a surprise." We then design and launch a test comparing the original checkout flow against a version with upfront shipping information. We measure the impact not on clicks, but on completed transactions. This methodical approach ensures that every change is a step toward higher conversion rates and a more efficient marketing funnel.
This isn't theory. For a Glasgow-based B2B technology partner, our customer journey mapping process uncovered a critical disconnect. They had strong traffic to their service pages but a lead conversion rate below 1%. The map revealed that while their ads successfully targeted the right pain points, the landing page language was filled with internal jargon that failed to resonate. We hypothesized that simplifying the copy to directly address the user's initial problem would increase engagement. After A/B testing new, user-centric copy, their qualified lead submissions increased by 25% within 90 days. Combined with a re-optimised ad strategy based on the journey insights, the client achieved a 40% increase in marketing ROI over the following two quarters.
Your customers evolve, and so should your strategy. A journey map is a living document, not a one-time project. We integrate journey audits into our quarterly performance reports, ensuring the strategy remains aligned with real-world user behaviour. This continuous analysis allows us to scale ad spend with confidence. By knowing precisely which paths convert best, we can allocate budget to the strongest parts of the funnel for predictable, scalable growth.
Internal teams often suffer from the "curse of knowledge," assuming customers understand their business as well as they do. An external perspective is critical for spotting these blind spots. We act as your strategic partner, committed to total transparency and measurable business impact. Our success is measured by your ROI and CPA, not vanity metrics. We build growth systems, not just campaigns. Ready to fix your leaky funnel? Let’s map your success.
The path to dominating your market in 2026 isn't a secret. It's a strategy. We've shown that effective customer journey mapping is far more than a flowchart; it’s a high-precision diagnostic tool for your entire digital ecosystem. You now have the framework to identify exactly where your PPC and paid social campaigns are losing budget and, more importantly, how to fix those leaks. It’s about transforming a static visualization into a dynamic, revenue-generating engine.
But a map is only useful if you have an expert navigator. At Behaviour Digital, we don't just build maps. We execute. As a Google Partner Agency based in the heart of Glasgow, our specialists in data-driven PPC and CRO turn behavioural insights into predictable, scalable growth. Stop guessing where your budget is going and start building a performance strategy grounded in hard data. Book a Digital Strategy Audit with Behaviour Digital today. The path to predictable growth is waiting.
The most common mistake is creating the map based on internal assumptions instead of actual customer data. This "inside-out" approach is a critical failure. A 2023 study by Forrester found that 63% of companies create maps without qualitative customer research. This leads to a fictional representation of the customer experience, making optimization efforts ineffective and wasting resources on solving problems that don't exist. The goal is a data-backed tool, not an internal brainstorming exercise.
A comprehensive journey map typically takes between 4 to 8 weeks to develop. This timeline covers essential phases: 2 weeks for data collection from analytics and surveys, 2-3 weeks for customer interviews and qualitative analysis, and 2-3 weeks for synthesis, visualization, and validation. Rushing this process, particularly the research phase, compromises the map's strategic value. A faster map might take 2 weeks but will lack the depth needed for meaningful business impact.
Yes, you can create a foundational journey map with limited data, but it must be treated as a hypothesis to be validated. Start with what you have: Google Analytics 4 user flow reports, heatmaps from tools like Hotjar, and sales team feedback. Your immediate next step, however, must be a plan to gather direct customer feedback, even starting with just 5-10 targeted interviews. Without this validation, your map remains a high-risk assumption, not a strategic asset for growth.
Your customer journey map should be reviewed quarterly and undergo a major update every 12-18 months. Quarterly reviews ensure the map reflects minor shifts in campaign performance or user behavior identified through analytics. The major annual update is non-negotiable. It's required to account for significant market changes, new product launches, or evolving customer expectations. A static map is an obsolete map; its value degrades by an estimated 25% per year if left untouched.
For 2026, your toolkit must integrate AI-powered analytics, qualitative research platforms, and collaborative visualization software. Expect to rely on AI within Google Analytics 5 for predictive behavior modeling. For qualitative data, platforms like Dovetail or UserTesting will be standard for analyzing interview transcripts. For visualization, collaborative tools such as Miro or FigJam remain essential, but with enhanced AI features for synthesizing data points directly onto the map. The focus is on efficiency and deeper insights.
Absolutely; customer journey mapping is critical for B2B companies in Scotland, where complex sales cycles and high-value clients are common. The average B2B sales cycle involves 6 to 10 decision-makers, according to Gartner's 2023 reports. Mapping this intricate process identifies key touchpoints, from an initial search on Google to a demo request. For a Scottish tech firm targeting the energy sector, for instance, it reveals where marketing and sales must align to accelerate the deal cycle.
Measure success by tracking specific KPIs tied to the friction points your map identified. Don't measure the map; measure its business impact. If your map highlighted a confusing checkout process, track the cart abandonment rate-aim for a 15-20% reduction post-fix. If it revealed a gap in onboarding, measure the change in your 30-day customer churn rate. Connect every insight from the map to a hard metric like conversion rate, customer lifetime value (CLV), or Net Promoter Score (NPS).
.png)
.png)
We help clients all over the globe grow their digital advertising campaigns. Ready to see what we can do for you? Get started with your free growth plan.
GET STARTED