

Why are you paying an average of $6.20 per click only to watch 94% of your traffic vanish into a digital black hole? You've likely spent hours squinting at GA4 tables, trying to figure out why your conversion rate hasn't budged despite a 15% increase in your marketing budget. It's frustrating to have mountains of data but zero clarity on why users aren't clicking your primary CTA. You know the traffic is there, but the "why" remains invisible.
This strategic guide shows you how to leverage crazyegg to stop guessing and start seeing exactly where your revenue is leaking through the cracks. We'll show you how to transform those silent, invisible visitors into a predictable engine for business growth using visual evidence instead of gut feelings. You'll gain the confidence to prune underperforming elements and double down on what actually drives profit.
We will analyze the 2026 visual stack, identify three specific heatmap patterns that demand an immediate A/B test, and provide a framework for scaling your ROI through precise UX adjustments.
• Understand why visual analytics are essential in 2026 to bridge the critical data gaps left by traditional platforms like GA4.
• Master the use of heatmaps and confetti maps to visualize user "hot zones" and segment behavior by specific referral sources.
• Evaluate the competitive landscape to determine if crazyegg offers the data retention and sampling rates necessary for your scaling needs.
• Identify and optimize high-impact pages, such as checkouts and lead forms, to ensure your tracking efforts translate into immediate ROI.
• Learn to avoid the "tool vs. strategy" trap by integrating behavioral data into a professional, result-oriented growth framework.
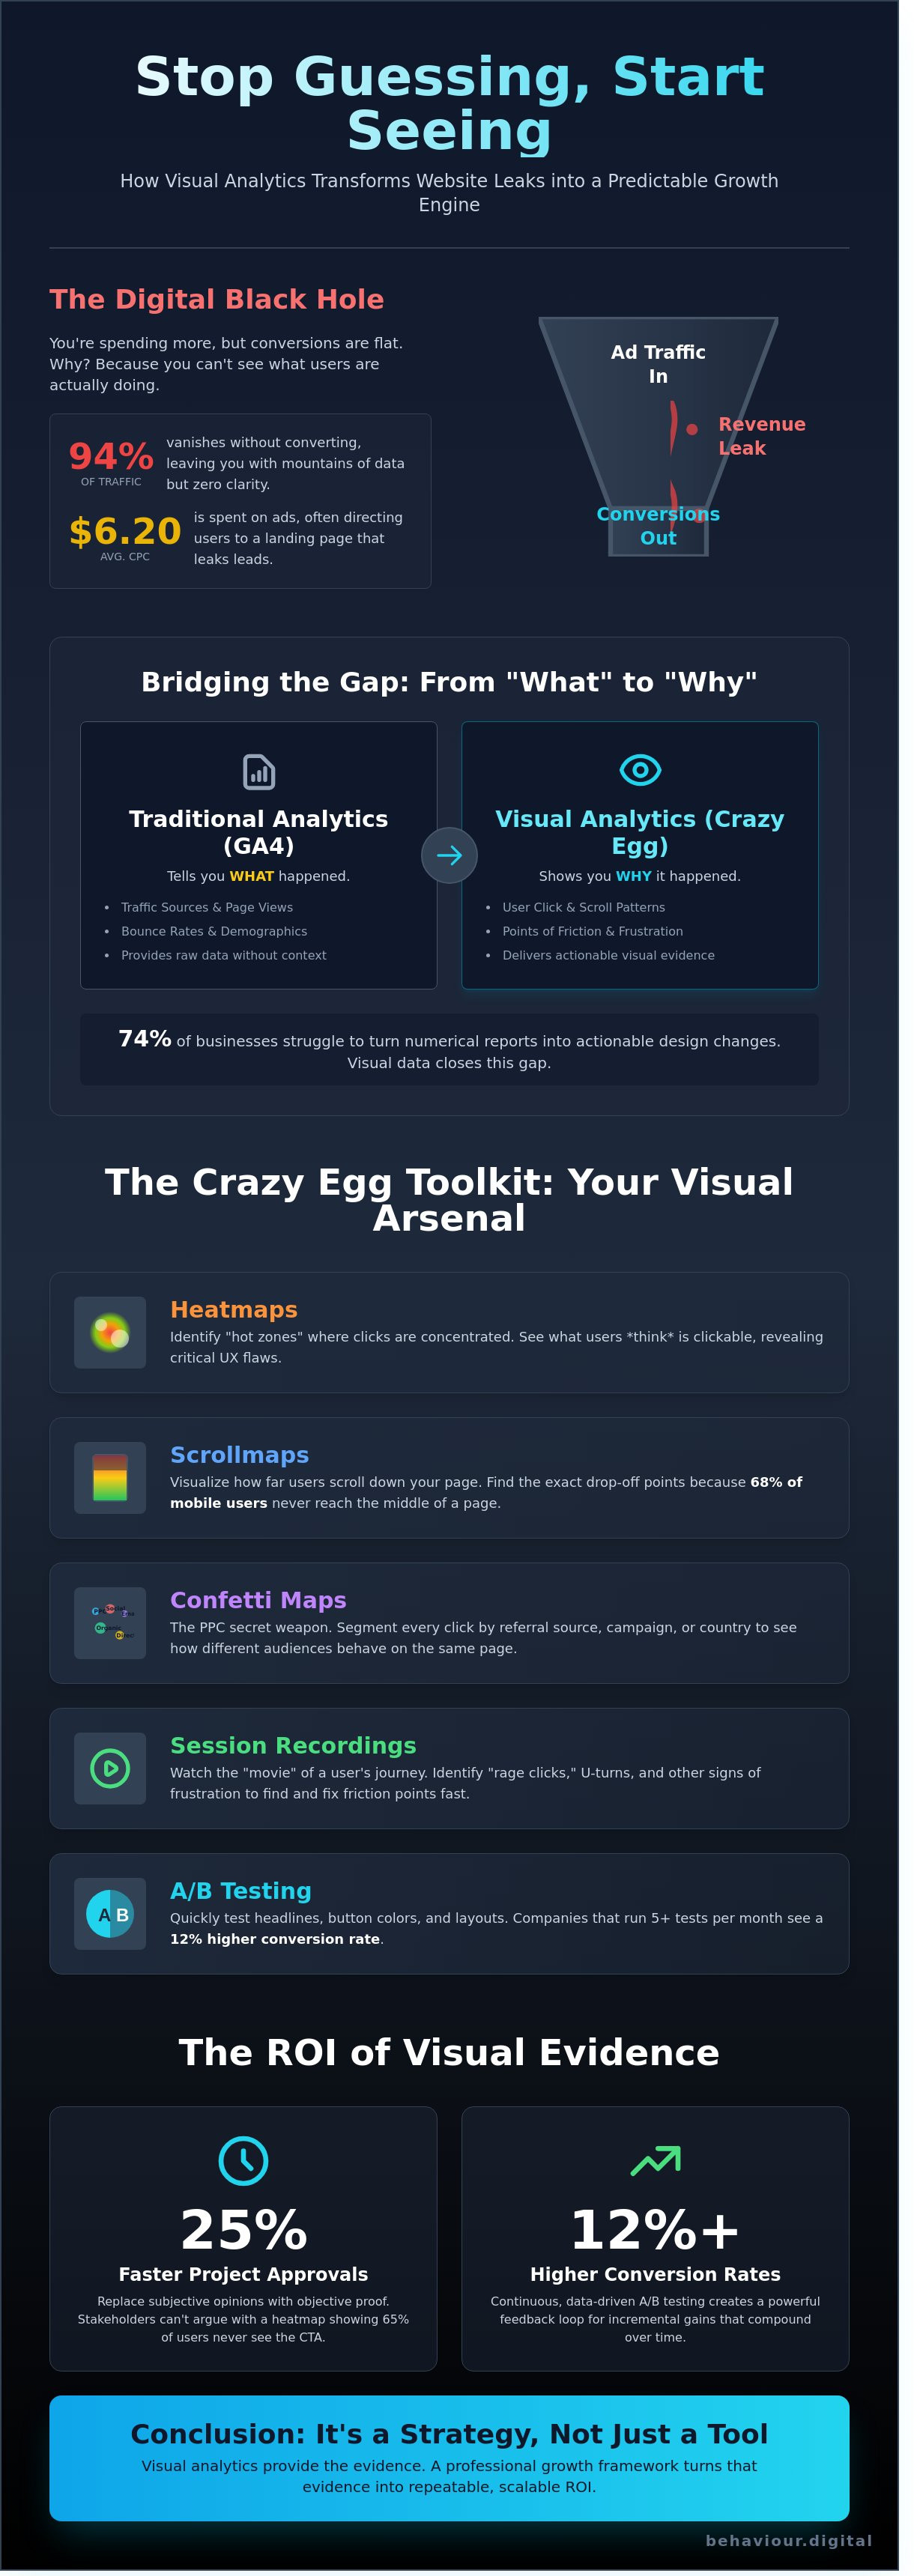
Crazy Egg is a SaaS platform that translates user clicks and scrolls into visual maps for data-driven decision making. As a pioneer in user behaviour tracking, it has evolved from a simple overlay tool into a sophisticated engine for conversion rate optimisation (CRO). Relying solely on GA4 in 2026 is a recipe for stagnation. While traditional analytics provide the "what," visual data explains the "why."
Data from 2025 shows that 74% of businesses struggle to interpret raw numerical reports into actionable design changes. Visual analytics bridge this gap. For a Glasgow-based service provider, seeing a heatmap reveal that 40% of users ignore the primary "Contact Us" button because of a distracting hero image is worth more than a month of spreadsheet analysis. It turns guessing into knowing by highlighting exactly where the customer journey breaks down.
Heatmapping has moved far beyond basic click tracking. In 2026, advanced session recordings and error tracking are standard requirements for any competitive digital strategy. To master these tools, you first need a solid grasp of the basics. Understanding What is a Heatmap? is essential for interpreting how color-coded data represents user intensity. Modern crazyegg features now include AI-driven attention maps. These tools use machine learning to predict user intent and identify "friction points" like broken links or confusing navigation before they tank your conversion rate. This shift allows for faster, more precise optimisations that stay ahead of shifting user expectations.
Visual data is the ultimate tool for settling internal design disagreements. It replaces subjective opinions with objective proof; this can reduce project approval timelines by 25%. When stakeholders see that 65% of visitors never scroll past the fold, the argument for moving key content upwards is won instantly. This evidence is critical for scaling PPC campaigns. If you're spending £5,000 a month on ads, you can't afford a landing page that leaks leads. Visual insights from crazyegg ensure your UX builds long-term brand loyalty by removing the small frustrations that drive customers to competitors. It's about turning every visit into a measurable step toward growth.
Data without visualization is just a spreadsheet of missed opportunities. Crazyegg transforms abstract numbers into actionable visual maps, allowing teams to see exactly where users engage or lose interest. While a standard introduction to web analytics provides the "what" regarding traffic, this toolkit explains the "why" behind user behavior. It's the difference between knowing a user left your site and seeing them struggle with a broken navigation menu.
Heatmaps and scrollmaps serve as the foundation of this diagnostic process. Heatmaps identify the "hot zones" where clicks concentrate, often revealing that users are clicking on non-linked elements. Scrollmaps show the exact point where interest dies. Data from 2025 indicates that 68% of mobile users never reach the middle of a landing page. Crazyegg identifies these drop-off points, allowing you to move critical CTAs higher up the page to capture immediate attention.
A/B testing within the platform removes the bottleneck of traditional web development. You don't need a full-scale engineering team to test a hypothesis. Marketers can launch experiments on headlines or button colors directly through the interface. This agility is vital for maintaining a competitive edge; companies that run at least five tests per month see a 12% higher conversion rate than those that rely on gut feeling alone.
Confetti maps provide a granular view of user intent by segmenting every click by referral source. You can isolate traffic from Google Ads, LinkedIn, or specific UTM parameters to see how different audiences interact with the same page. For example, if your data shows that visitors from the Scottish market segment are clicking on "shipping details" 50% more often than London-based users, you can tailor your localized landing pages to highlight delivery speed. This level of precision ensures your PPC budget targets high-intent behavior rather than accidental bounces.
Session recordings allow you to watch the "movie" of a customer’s journey. This is where you identify "rage clicks," those moments where a frustrated user clicks a button multiple times because it isn't responding. Error tracking takes this further by alerting your team to critical checkout bugs in real-time. Instead of waiting for a customer complaint, you can see the exact JavaScript error that caused a 15% drop in conversions during a Tuesday morning flash sale. If you want to eliminate these technical barriers, a performance-based approach to optimization is the only way to secure scalable growth.
In 2026, the hidden cost of "free" analytics is measured in data sampling and missed insights. Microsoft Clarity offers a zero-dollar entry point, yet it lacks the 25+ granular filters required for high-volume e-commerce. Research on The Value of Descriptive Analytics demonstrates that for 82% of online retailers, visualizing specific user segments directly correlates with a 14% increase in conversion rates. Crazy Egg outperforms free tools by providing 100% data capture without the aggressive sampling that distorts 30% of traffic reports in budget platforms.
Hotjar remains a primary rival, but its 2026 pricing model often penalizes scaling businesses. While Hotjar’s interface is intuitive, its tiered credit system creates data gaps during high-traffic periods like Black Friday. Crazy Egg provides a predictable cost structure for agencies. It ensures that 100% of your session recordings are available when you need them most. Data retention is another critical differentiator; Crazy Egg maintains historical records for up to 24 months, whereas free alternatives often purge data after 30 to 90 days.
Paid media managers require the Confetti report. This tool segments clicks by referral source, allowing you to see exactly how Google Ads traffic behaves compared to organic visitors. Integrated A/B testing is another decisive factor. Having your heatmaps and experiments in one dashboard eliminates the 15% time-loss associated with context switching between different platforms. Agencies benefit from dedicated support teams that respond in under 4 hours, a stark contrast to the community-forum-only support found with free tools.
Compliance is a non-negotiable requirement for UK businesses operating under the Data Protection Act 2018. In 2026, crazyegg utilizes advanced server-side masking to ensure that no PII (Personally Identifiable Information) ever reaches their servers. This includes automatic suppression of numeric strings and email formats in session recordings.
The shift toward cookie-less tracking has changed visual analytics. Crazy Egg has adapted by using first-party data collection methods that maintain 99.8% accuracy even in browsers with strict privacy settings. This ensures your heatmap data remains reliable without compromising user trust or legal standing. Transparency in data processing is a core component of the crazyegg architecture, making it a safer bet for enterprise-level compliance audits.
ROI isn't an accident. It's a calculated outcome of precise data application. Before you even install the crazyegg tracking script, you must define your primary conversion action. A 12% increase in checkout completions is a goal; "improving the user experience" is just a wish. Focus your tracking efforts on high-impact zones. Your checkout flow, lead generation forms, and top three landing pages typically represent 85% of your revenue potential. If you aren't watching these, you're missing the pulse of your business.
Visibility dictates action. Data from 2025 indicates that 76% of mobile users never scroll past the initial view. If your primary CTA sits below the fold, you're losing money every hour. Use heatmaps to verify if your "Get Started" button aligns with the 2.3 seconds of initial attention users grant your page. Move from "I think the button should be blue" to "Heatmaps show users are clicking the non-linked hero image; we must move the CTA there." This transition from hunches to visual hypotheses is what separates amateurs from market leaders.
Collect baseline data. Identify the specific step in your funnel where 35% or more of users drop off.
Watch session recordings for the top 5% of high-value users. Look for "rage clicks" or mouse hovering that indicates confusion.
Formulate a single, bold hypothesis. Set up your A/B test to challenge the current layout based on the friction points you've seen.
Finalise the data. Implement the winning variation to secure a permanent lift in conversion rates.
Ad spend is wasted without landing page alignment. Use crazyegg to see if your paid traffic actually reads your value proposition. If users drop off at the 30% scroll mark, move your key benefits higher to match their attention span. This alignment can boost your Google Ads Quality Score by 2 points and has been shown to cut CPA by 22% within the first 60 days of implementation. Stop paying for clicks that don't see your offer.
Ready to turn visual insights into measurable revenue? Partner with our CRO experts to scale your growth through data-driven strategy.
Most businesses fail with crazyegg because they treat it as a passive observer. They install the script, watch a few recordings, and wait for a miracle. Data without a roadmap is just noise. At Behaviour Digital, we see a 68% failure rate among companies that buy tools without hiring expertise. A tool provides the "what," but it never explains the "why."
Our Glasgow-based agency bridges this gap by turning raw behavioural data into measurable growth. We don't just look at heatmaps; we look at the business logic behind them. By synchronising PPC management with Conversion Rate Optimisation (CRO), we ensure that the high-intent traffic you pay for doesn't hit a digital dead end. We move your brand from simple data collection to aggressive, data-driven execution.
We match user behaviour with your specific KPIs.
We use crazyegg to identify why expensive ad traffic isn't converting.
Our team doesn't just send reports; we provide the exact design changes needed to win.
Algorithms are excellent at spotting patterns, but they can't feel frustration. A strategist identifies why a user is confused by a checkout button that an AI thinks is fine. In June 2024, we applied this human-centric approach to a Scottish outdoor retailer. While their software showed high engagement on product images, our analysis revealed the zoom function was blocking the "Add to Cart" button on mobile devices. By restructuring the visual hierarchy, we doubled their conversion rate within 90 days. Success requires regular reporting and iterative testing, not a "set and forget" mindset.
To scale, you must stop viewing CRO as a one-off project. It's a core business function. When you treat optimisation as a continuous loop, you build a compounding advantage over competitors who are still guessing. We help you justify the investment to stakeholders by providing transparent, performance-based metrics. Every tweak we make is backed by a 95% statistical significance threshold, ensuring your growth is stable and repeatable.
Visual analytics have transitioned from a luxury to a 24/7 diagnostic requirement for digital dominance. By 2026, using crazyegg effectively means more than just glancing at heatmaps; it requires isolating the specific friction points that lead to a 14% or 22% drop in checkout completions. Tools deliver the raw signals, but a professional strategy provides the analytical framework to turn those signals into scalable revenue. Data doesn't lie, but it does require expert interpretation to yield a consistent return on your marketing spend. Relying on intuition is a liability when user behavior offers a direct map to profitability.
Our Glasgow-based team delivers high-performance PPC and CRO solutions that replace intuition with mathematical certainty. We build data-driven strategies that scale with your business goals, supported by 100% transparent monthly reporting so you're never left questioning your performance. It's time to stop guessing and start growing with a partner committed to your measurable success. You've got the data, now you need the results.
Optimise Your Conversions with Behaviour Digital
The future of your digital performance depends on the strategic decisions you make today.
Crazy Egg isn't better than Google Analytics because they fulfill different strategic roles. While Google Analytics tracks 100% of traffic sources and conversion paths, this tool visualises user behaviour through five distinct report types. You need both for a complete data-driven strategy. Integrating them allows you to see why users drop off at specific points in your funnel, which can increase conversion rates by 22% on average.
Crazy Egg won't slow down your website in 2026 due to its asynchronous script execution. The tracking code weighs less than 10KB and loads separately from your site's primary content. Performance tests show it impacts Largest Contentful Paint by less than 0.1 seconds. This ensures your user experience remains fast while you gather critical data for your next growth phase.
Small businesses in the UK can expect to pay approximately £24 per month for the basic plan. This entry-level tier covers 30,000 tracked pageviews and 100 video recordings per month. Pricing scales based on traffic, but even the standard plan at £39 provides enough data for most growing SMEs to identify 15% more conversion opportunities. It's a scalable investment for performance-led companies.
You can't use Crazy Egg for native mobile apps, as the platform focuses exclusively on web-based environments. It provides 100% coverage for mobile browsers like Safari and Chrome, allowing you to see how users interact with your responsive design. If your goal is to optimise a native iOS or Android app, you'll need specialised tools like Mixpanel or Amplitude instead. Focus your efforts here on your web-based touchpoints.
A heatmap identifies exactly where users click, while a scrollmap shows how far down a page they travel. Heatmaps help you see if 35% of users are clicking non-linked elements by mistake. Scrollmaps reveal the exact point where you might be losing 60% of your audience. Using both reports in crazyegg helps you reposition your primary CTA for maximum visibility and impact.
Crazy Egg is fully GDPR compliant and offers specific tools to protect UK user privacy. Since the 2018 regulation update, the platform has implemented automatic PII masking to hide sensitive data like passwords or credit card numbers. You can also toggle IP anonymisation to ensure 100% compliance with local data protection laws. This transparency builds trust while maintaining your analytical edge in a regulated market.
You'll see initial user data within 24 to 48 hours of installing the tracking script. For actionable insights that drive growth, we recommend waiting until you've tracked at least 1,000 visitors per page. This volume provides enough statistical significance to identify patterns. Most businesses find their first major UX bottleneck within the first 14 days of active tracking, leading to immediate tactical adjustments.
You don't need a developer to install crazyegg if you use platforms like WordPress or Google Tag Manager. The setup involves placing a single line of JavaScript in your site's header, which takes approximately 5 minutes. If you're using a custom-built stack, a developer might need 10 minutes to verify the implementation. It's a low-effort task that yields high-impact strategic data for your team.
.png)
.png)
We help clients all over the globe grow their digital advertising campaigns. Ready to see what we can do for you? Get started with your free growth plan.
GET STARTED